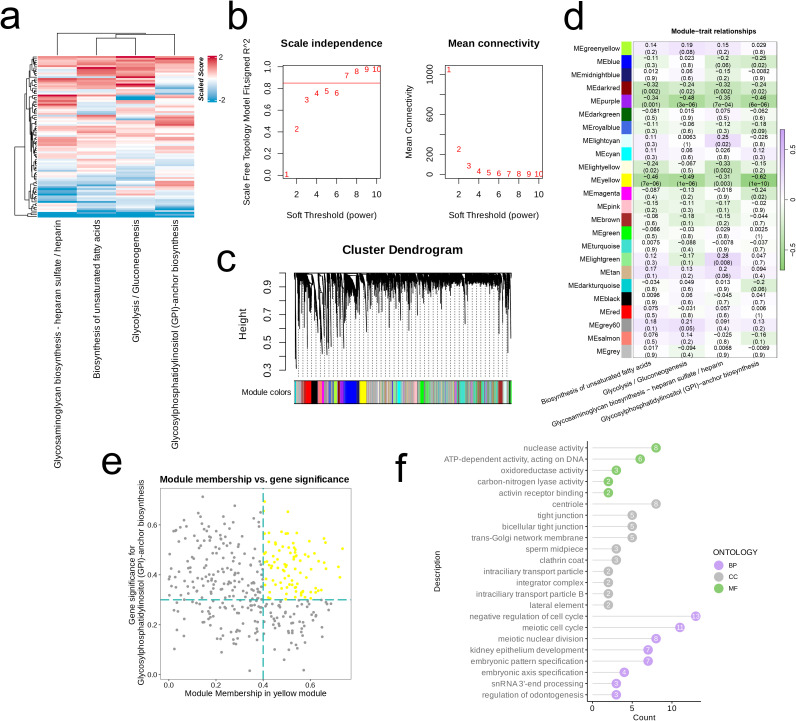
Figure 5.
Metabolism-related genes were screened by WGCNA. (A) Heatmap of the four highly activated metabolic pathways. (B) Analysis of the scale-free index for various soft-threshold powers (β). (C) Cluster dendrogram of the coexpression modules. Each color indicates a co-expression module. (D) Module-trait heatmap displaying the correlation between module eigengenes and clinical traits. (E) Correlation between module membership and gene significance in the yellow modules. Dots in colors were regarded as the hub genes of the module. (F) The top enriched GO terms of the hub genes of the module.

