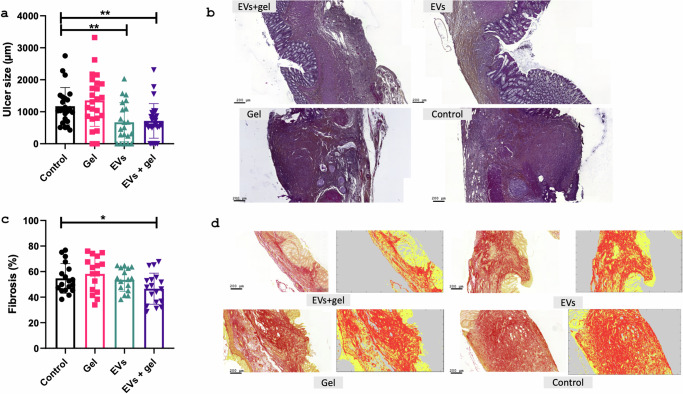
Fig. 6. Histological analysis of the anastomosis.
a graph representing the measurement of ulcer size at the anastomosis site (±SD). Two series of slides were analyzed in 8 rats of the control and gel groups. Nine rats of the EVs and EVs+gel groups were analyzed. b representative picture of HES slides at the colo-colic anastomosis level in the different groups (scale bar = 200μm). c graph representing the percentage (±SD) of fibrosis at the anastomosis level using the FIBER-ML program (scale bar = 200 μm). Two series of slides were analyzed in 8 rats of the control and gel groups. Nine rats of the EVs and EVs+gel groups were analyzed. d representative picture of RS slides and after the use of FIBER-ML program at the colo-colic anastomosis level (scale bar = 200 μm).

