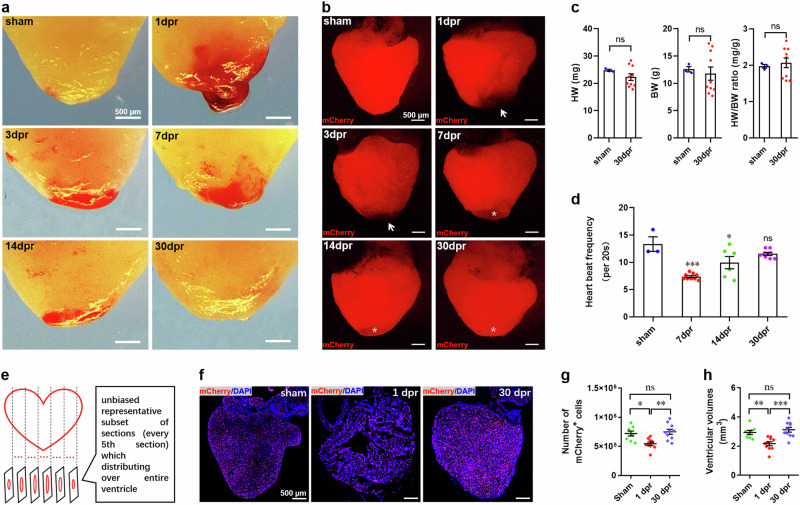
Fig. 3. Regeneration of ventricular myocardium of adult Tg(mlc2:H2C) transgenic X. tropicalis line.
a Representative bright-field images of adult hearts from F1 Tg(mlc2:H2C) frogs at the indicated time points after apical resection injury. b Representative epifluorescence images of adult hearts from F1 Tg(mlc2:H2C) frogs at the indicated time points after apical resection injury. Arrow marks the removed apex. Asterisk marks the restored apex. c Quantification of heart weight (HW), body weight (BW), and HW/BW ratio of frogs in sham-operated and 30 dpr groups. Data are presented as mean ± SEM (n = 3 ~ 10 frogs). Ns, no significant difference (Student’s t test). d Quantification of heart rate at 30 dpr indicating the restoration of normal systolic function of regenerated hearts. Data are presented as mean ± SEM (n = 3 ~ 10 frogs). *p < 0.05, ***p < 0.001 versus control, ns denotes no significant difference (one-way ANOVA test). e Schematic for quantification of ventricular cardiomyocyte numbers and ventricular volumes. f Representative images of adult hearts at the indicated time points after apical resection injury. g, h Quantification of ventricular cardiomyocyte numbers (g) and ventricular volumes (h) at the indicated time points. Data are presented as mean ± SEM (n = 8 ~ 10 hearts per group). *p < 0.05, **p < 0.01, ***p < 0.001 versus control, ns denotes no significant difference (one-way ANOVA test). This figure was created by Photoshop Image 12 software using our own data in the work.

