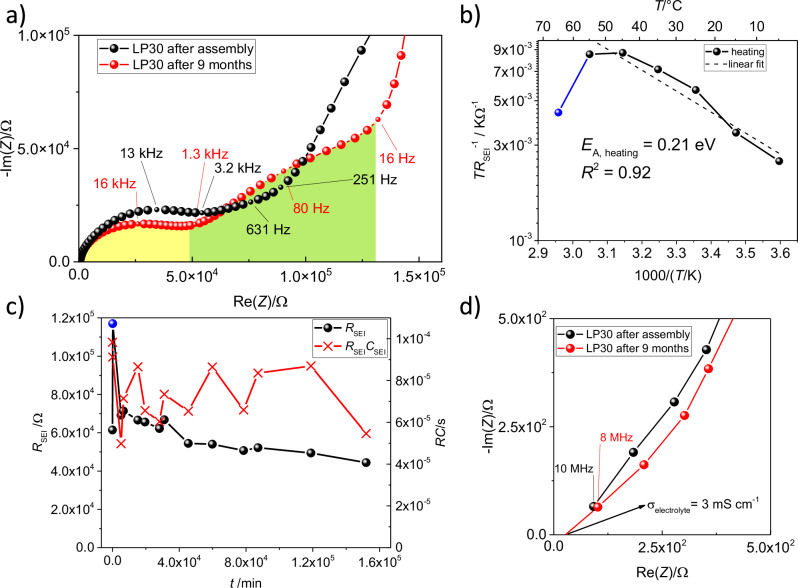
Fig. 1. Results of electrochemical impedance spectroscopy performed on Si │ LP30 │ Si cells.
a Nyquist plots for cells directly after assembly (black) and after 9 months of close to OCV ageing (red), yellow shade under the black curve marks the SEI semicircle after nine months, green shade marks the charge-transfer contribution. b Activation energy investigation of the ion transport through the interphase. Blue datapoint at 65 °C was excluded from the linear fit as it probably stemmed from accelerated cell ageing due to high temperatures. c Time-dependent change of SEI resistance, RSEI (black dots), and the time constant, RC (red crosses). d Nyquist plot zoom in of (a) close to x-intercept for the first semicircle, showing the 45° slopee. The calculated ionic conductivity of the electrolyte after nine months is 3 mS cm−1.

