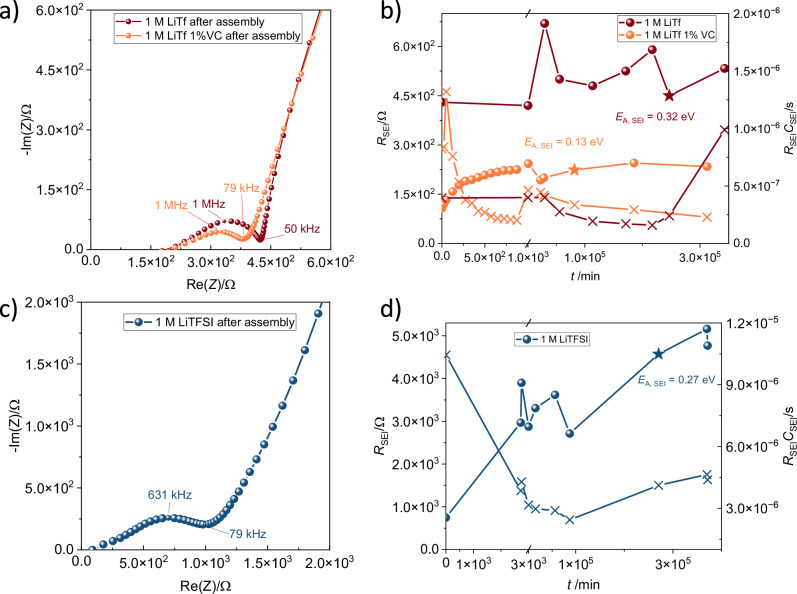
Fig. 2. Results of electrochemical impedance spectroscopy from cells containing symmetric Si electrodes in contact with different triglyme-based electrolytes.
a Nyquist plots for cells directly after assembly with 1 M LiTf in triglyme (brown dots) and 1 M LiTf with 1 wt% VC (orange dots). b Time-dependent change of SEI resistance for LiTf cells. A different linear timescale was used for the time shortly after assembly to show RSEI during the first 1000 min in a more visible way. c Nyquist plot for a 1 M LiTFSI in triglyme cell after assembly. d Evolution of the SEI resistance and RC over time for the 1 M LiTFSI cell. In (b, d), stars denote when the EA of the SEI semicircle was measured, while crosses denote the change of RC of the SEI over time.

