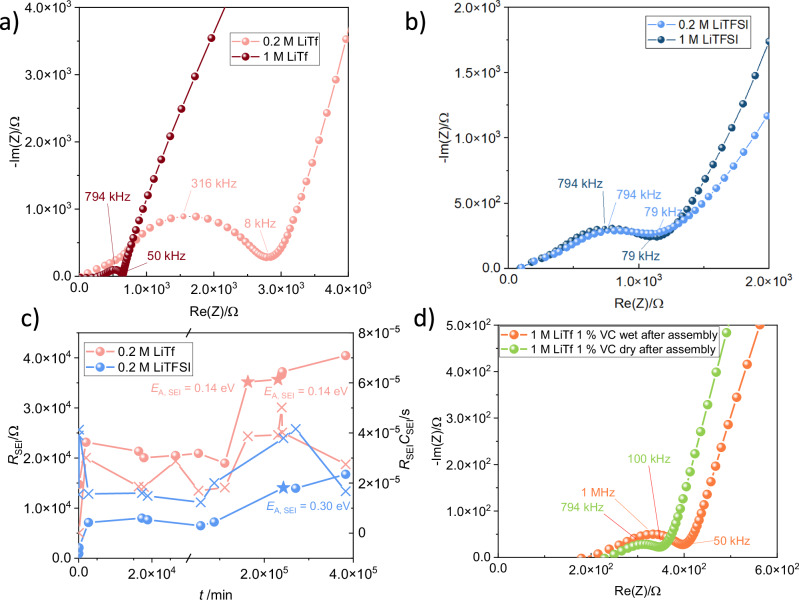
Fig. 3. Effects of concentration and water content on the SEI resistance from cells containing symmetric Si electrodes in contact with different triglyme-based electrolytes.
a Nyquist plots for cells directly after assembly with 1 M LiTf in triglyme (brown dots) and 0.2 M LiTf (pink dots). b Nyquist plots for cells directly after assembly with 1 M LiTFSI in triglyme (dark blue dots) and 0.2 M LiTFSI (light blue dots). c Time-dependent change of SEI resistance, RSEI, and time constant, RC for cells with 0.2 M LiTf and LiTFSI. d Nyquist plots for cells containing 1 M LiTf with 1 wt% VC and 12 ppm H2O (dry) and 600 ppm H2O (wet) directly after assembly (green and orange dots).

