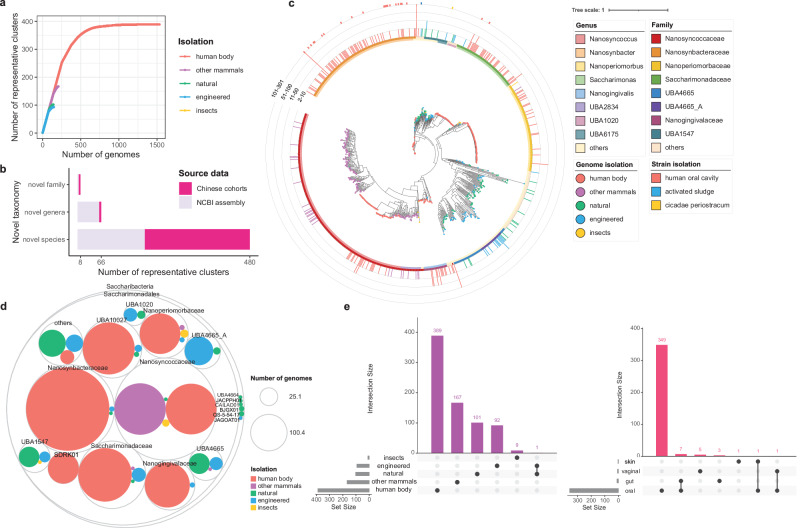
Fig. 1. Taxonomic profile of Saccharibacteria.
a Rarefaction curves of the number of representative clusters obtained as a function of the number of genomes analyzed. Separate colored curves are depicted for clusters from different environments. b Stack plots showing a number of new taxa contributed by Saccharibacteria representative clusters. The numbers of novel taxa at the species, genus, and family levels are shown separately, colored by public data or China cohorts. c Maximum-likelihood phylogenetic tree of the 2041 genomes. The inner dots are colored by the environment for each cluster, with the outer layer depicting the GTDB genus and family annotation. Bar graphs indicate the number of genomes from each cluster. The cluster containing the cultured strains is displayed on the outermost layer. d Circle packing plot, displaying the isolation source of different Saccharibacterial taxa. Number of genomes analyzed per taxon is indicated by the circle size. e Upset plot, displaying the number of clusters found across different types of environments and different niches of the human body, ordered by level of overlap. Vertical bars represent the number of clusters shared between the different environments or human body niches highlighted with dots in the lower panel. Horizontal bars in the lower panel indicate the total number of clusters in each type of environment or human body niche.

