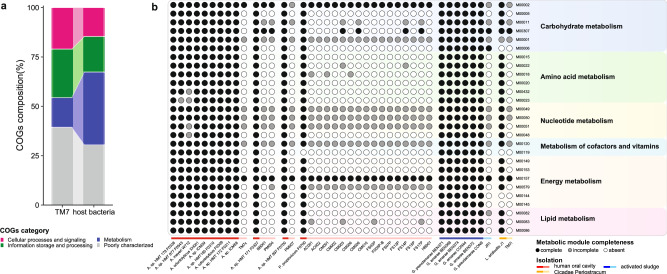
Fig. 2. The metabolic dependency between Saccharibacteria and their bacterial hosts.
a COG function composition of genomes of cultured Saccharibacteria and their host bacteria, colored by COGs category. b Heatmap showing metabolic module completeness of genomes of Saccharibacteria and their bacterial hosts. Rows indicate metabolic modules. Columns indicate genomes of Saccharibacteria and their host bacteria. The color of the circles represents the completeness of metabolic modules in each genome, black circles represent complete metabolic modules, gray circles represent incomplete metabolic modules, white circles represent the metabolic module is absent. Specific parasitic pairs are represented by horizontal lines, colored by the isolation source of organisms, darker colors represent host bacteria, lighter colors represent Saccharibacteria.

