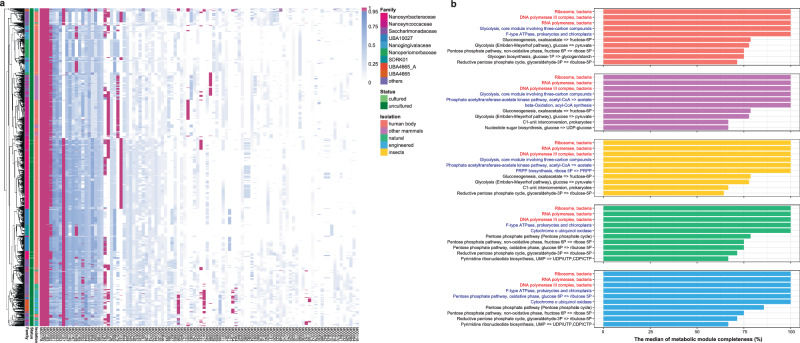
Fig. 3. The metabolic potential of Saccharibacteria is limited.
a Heatmap of the metabolic module completeness of the 2041 genomes of Saccharibacteria. Rows indicate genomes of Saccharibacteria. Columns indicate metabolic modules, only the 100 modules with the highest sum of module completeness in 2041 genomes are displayed. The color of the cell represents the completeness of the metabolic module. Color of the cell indicates the completeness of the metabolic module, purple and blue of the cell represents metabolic modules above and below 95%, respectively. The family annotation, isolation source and culture status are indicated by column annotation. b Bar plot showing the median of metabolic module completeness of genomes of Saccharibacteria from different habitats. Only the top ten modules with the highest median of each habitat were shown. The red color of the module text indicates that the module is complete in all genomes of Saccharibacteria, and the blue color indicates that the median of the completeness of the metabolic module in the genomes from a certain habitat is 100%. Annotation of genome isolation source as in (a).

