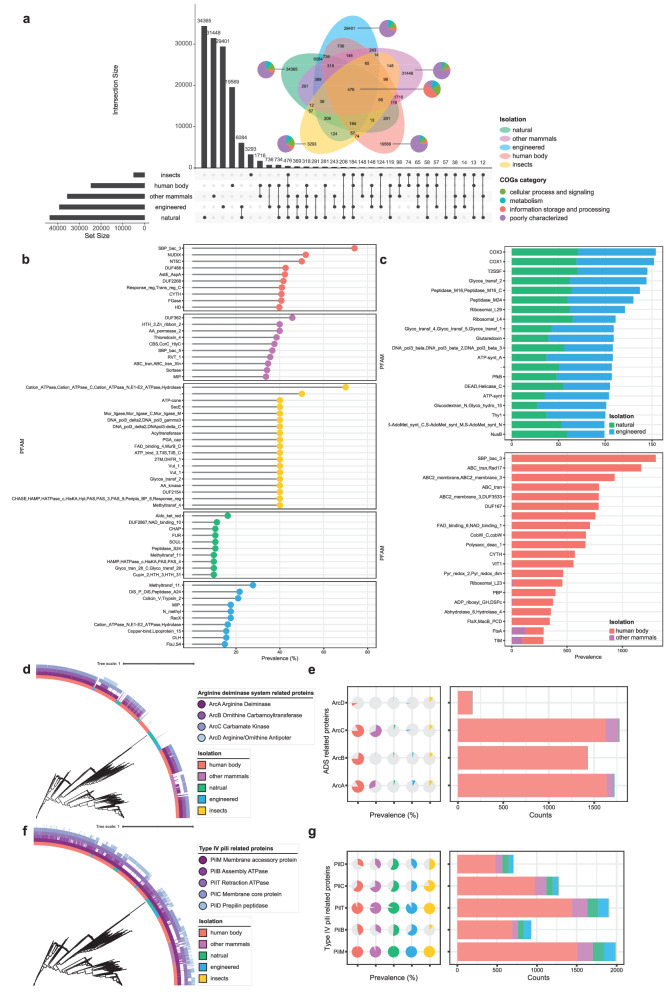
Fig. 4. Comparative genomic analysis of Saccharibacteria.
a Lollipop chart showing the PFAMs corresponding to the top ten unique protein clusters of each habitat. b Cleveland dot plots showing the PFAMs composition corresponding to top 20 shared protein clusters of Saccharibacteria from different environments. c Upset plot and Venn diagram displaying the number of protein clusters found across different types of environments. Vertical bars of the upset plot represent the number of protein clusters shared between the different environments. Horizontal bars of the upset plot in the lower panel indicate the total number of protein clusters in each type of environment. A Venn diagram was added with the COG composition of protein clusters. d Phylogenetic tree of 2041 genomes combined with the heatmap on the outermost layer indicating the isolation source of genomes and the presence or absence of ADS-related proteins. e Distribution patterns of ADS-related proteins in the genome collection, colored by the same annotation of isolation source of genomes as in (d). f Phylogenetic tree of 2041 genomes combined with the heatmap on the outermost layer indicating the isolation source of genomes and the presence or absence of T4P-related proteins. g Distribution patterns of T4P-related proteins in the genome collection, colored by the same annotation of isolation source of genomes as in (f).

