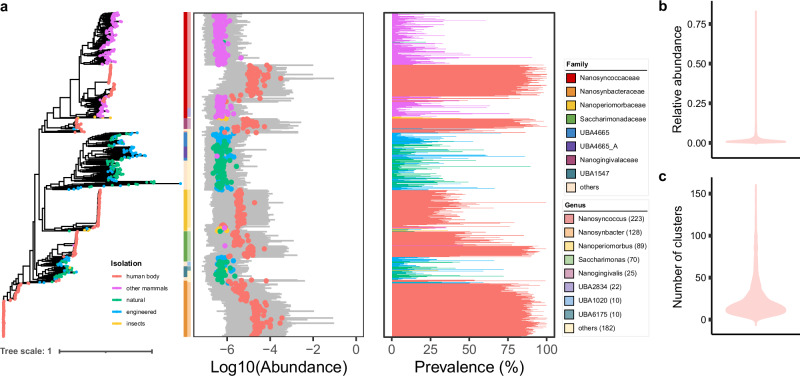
Fig. 5. The distribution of Saccharibacteria in Chinese oral cavity.
a Abundance and prevalence of Saccharibacteria in Chinese oral cavity. Gray box, Log10 (relative abundance); Dot, median of log10 (relative abundance); Bar, prevalence; color, isolation of clusters. Columns, genus, and family of clusters. b Violin plot displaying a relative abundance of Saccharibacteria in each sample. c Violin plot displaying the number of clusters of Saccharibacteria in each sample. Only the number of clusters with relative abundances above 0.01% in each sample is shown.

