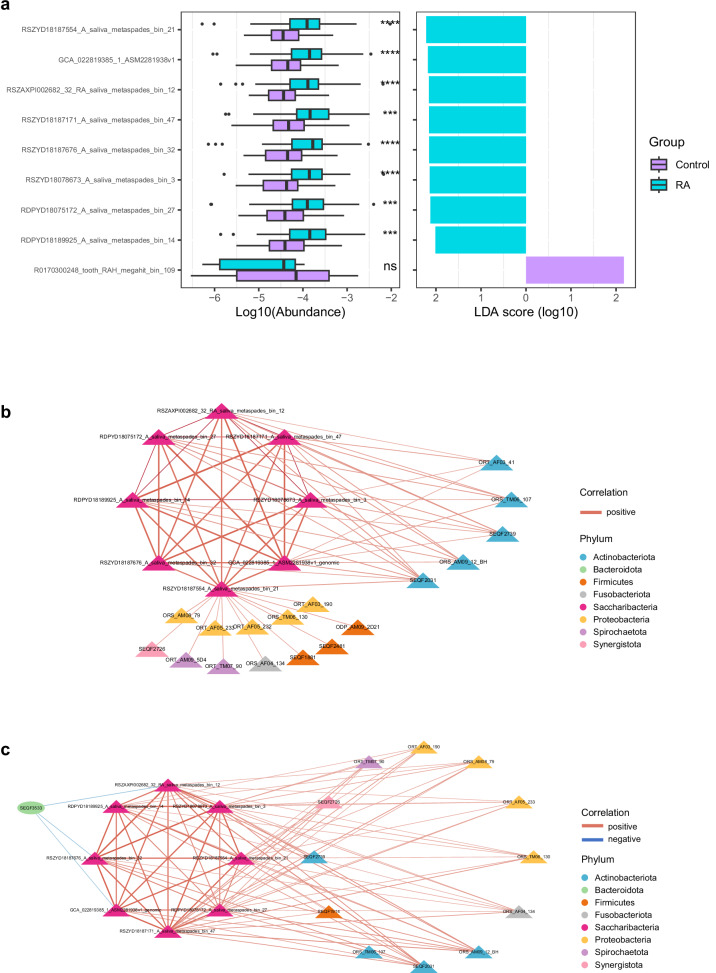
Fig. 6. Differential patterns of Saccharibacterial clusters in 47 healthy controls (HC) and 50 patients with rheumatoid arthritis (RA).
a The logarithm of abundance (base 10) in each group of differentially abundant Saccharibacterial clusters and the LDA scores of differentially abundant Saccharibacterial clusters analyzed by Linear discriminant analysis Effect Size (LEfSe) analysis (P < 0.05, LDA > 2), colored according to enrichment group. P values are from Wilcoxon rank-sum test (two-sided), and adjusted using the Benjamini–Hochberg procedure, ****P < 0.0001, ** P < 0.01, ns, not significant. b Correlation network of Saccharibacterial clusters and related bacterial clusters differing in abundance in each group in HC. The nodes are colored by phylum. Triangle nodes reflect clusters enriched in RA. c Correlation network of Saccharibacterial clusters and related bacterial clusters differing in abundance in each group in RA. The nodes are colored by phylum. Triangle nodes reflect clusters enriched in RA, and oval nodes reflect clusters enriched in healthy controls. b, c Positive correlations are indicated by red edges and negative correlations by blue edges. Spearman’s correlation is used to calculate correlation, adjusted P values (P < 0.05) are determined using the Benjamini–Hochberg procedure.

