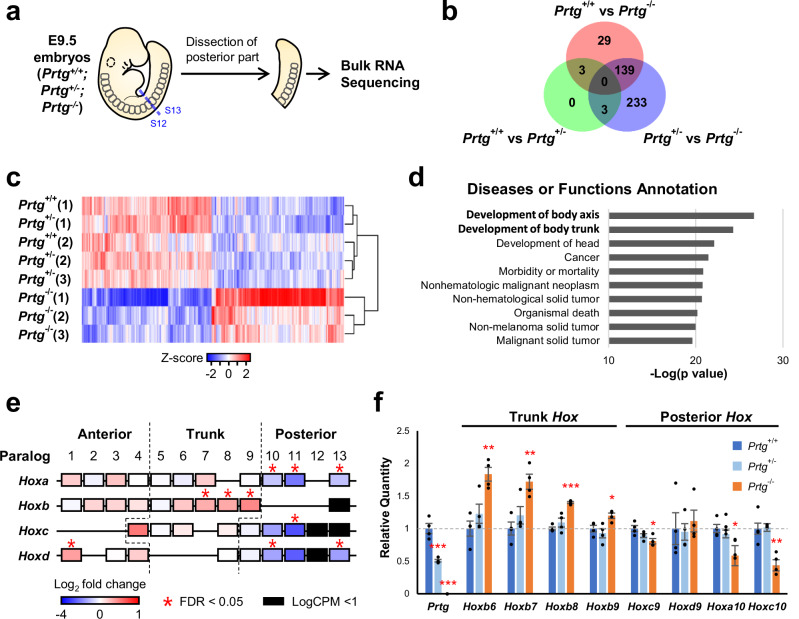
Fig. 2. Transcriptome analysis of the posterior trunks of E9.5 Prtg−/− embryos.
a Schematic representation of the experimental design for transcriptome analysis. E9.5 embryos were dissected between the 12th and 13th somite, and the posterior trunks were subjected to bulk RNA-seq analysis. b Numbers of differentially expressed genes (DEGs) observed in Prtg+/+ vs Prtg+/−, Prtg+/+ vs Prtg−/−, and Prtg+/− vs Prtg−/− embryos. DEGs were identified using edgeR with FDR < 0.05 as the cutoff. c Heatmap of DEGs in the Prtg+/+, Prtg+/−, and Prtg−/− samples. A total of 529 DEGs were identified between the control (Prtg+/+ and Prtg+/−) and Prtg−/− samples, among which 267 and 262 genes were up-regulated and down-regulated in the Prtg−/− samples, respectively. d Diseases or Functions Annotation generated via Ingenuity Pathway Analysis (IPA) illustrating the significant association of Prtg-regulated genes with body axis development. e Heatmap illustrating the fold change in Hox gene expression observed in Prtg−/− samples relative to control embryos (Prtg+/+ and Prtg+/−), derived from RNA-seq data. f The expression levels of Prtg, Hoxb6, Hoxb7, Hoxb8, Hoxb9, Hoxc9, Hoxd9, Hoxa10, and Hoxc10 in the posterior trunk samples of Prtg+/+, Prtg+/−, and Prtg−/− embryos were quantified using RT-qPCR. Tbp was used as the reference gene. Data are presented as the mean ± SEM. Statistical significance relative to Prtg+/+ is indicated (n = 4 for each bar; *p < 0.05; **p < 0.01; ***p < 0.001, by one-way ANOVA).

