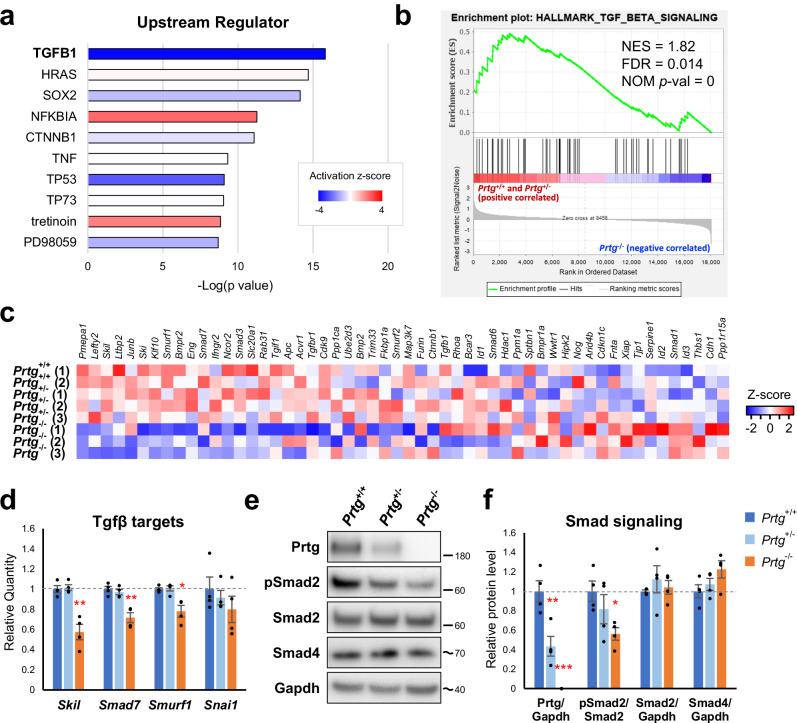
Fig. 3. Down-regulation of TGFβ signaling activity in the posterior trunks of E9.5 Prtg−/− embryos.
a Upstream regulator analysis via IPA demonstrated that the DEGs in the Prtg−/− samples were significantly associated with TGFβ1. b GSEA revealed that TGFβ signaling was significantly altered in Prtg−/− embryos. c Heatmap of the expression levels of genes within the TGFβ signaling gene set. d The expression levels of TGFβ signaling target genes in the Prtg+/+, Prtg+/−, and Prtg−/− posterior trunk samples were quantified using qRT-PCR. Tbp was used as the reference gene. Data are presented as the mean ± SEM. Statistical significance relative to Prtg+/+ is indicated (n = 4 for each bar; *p < 0.05; **p < 0.01; ***p < 0.001, by one-way ANOVA). e Western blot analysis of the Prtg, phosphorylated Smad2 (pSmad2), total Smad2, and Smad4 levels in Prtg+/+, Prtg+/−, and Prtg−/− posterior trunk samples. Gapdh was used as an internal control. The molecular weight ladders are labeled, and the estimated molecular weight size is indicated by a tilde. f Quantitative results of (e). The level of pSmad2 was significantly decreased in the Prtg−/− samples. Data are presented as the mean ± SEM. Statistical significance relative to Prtg+/+ is indicated (n = 4 for each bar; *p < 0.05; **p < 0.01; ***p < 0.001, by one-way ANOVA).

