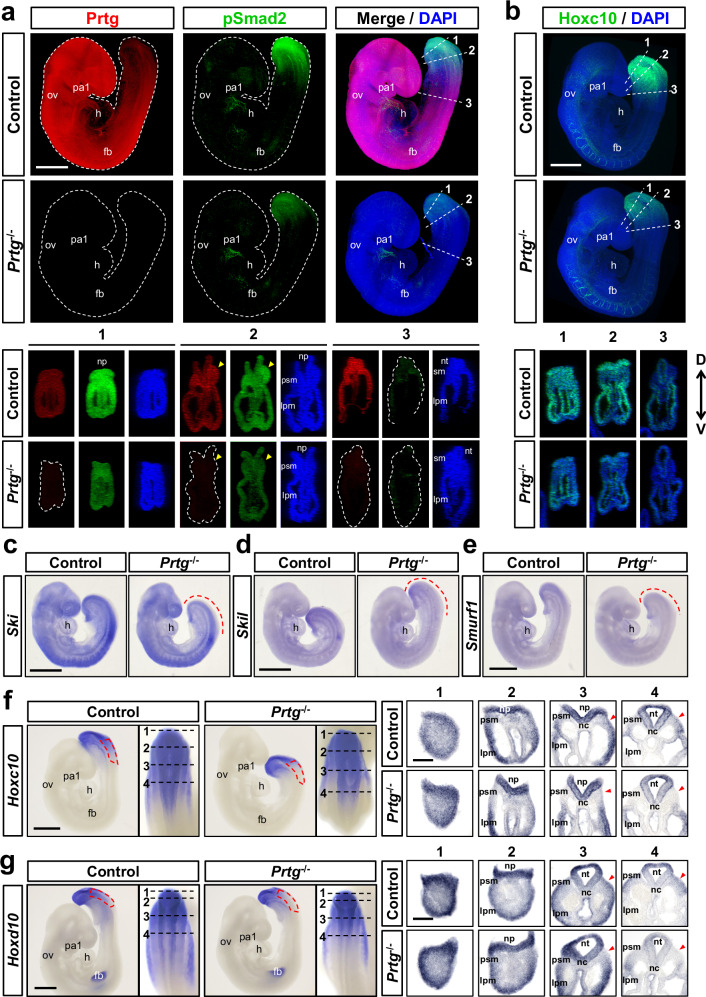
Fig. 4. Decreased TGFβ signaling activity in the PSM of Prtg−/− embryos.
a Whole-mount immunostaining of Prtg (red), pSmad2 (green), and DAPI (blue) in E9.5 control and Prtg−/− embryos. Digital transverse sections at the indicated levels in the whole-mount embryos are shown at the bottom (n = 8 embryos per group). Scale bars represent 500 µm. b Whole-mount immunostaining of Hoxc10 (green) and DAPI (blue) in E9.5 control and Prtg−/− embryos (n = 4 embryos per group). Digital transverse sections at the indicated levels in the whole-mount embryos are shown at the bottom. Arrowheads indicate the PSM regions. Scale bars represent 500 μm. D dorsal, V ventral. c–e Whole-mount in situ hybridization of Ski (n = 2) (c), Skil (n = 2) (d), and Smurf1 (n = 2) (e) in E9.5 control and Prtg−/− embryos. Dashed lines indicate regions where the expression levels are decreased in Prtg−/− embryos. Scale bars represent 500 µm. f, g Whole-mount in situ hybridization of Hoxc10 (n = 2) (f) and Hoxd10 (n = 2) (g) in E9.5 embryos. Red dashed boxes indicate regions of reduced expression levels of the indicated gene in Prtg−/− embryos. Dashed lines indicate the positions of sections in the right panels. Scale bars represent 500 µm in whole-mount images and 100 µm in sections. fb forelimb bud, h heart, lpm lateral plate mesoderm, nc notochord, np neural plate, nt neural tube, ov otic vesicle, pa1 1st pharyngeal arch, psm presomitic mesoderm, sm somitic mesoderm.

