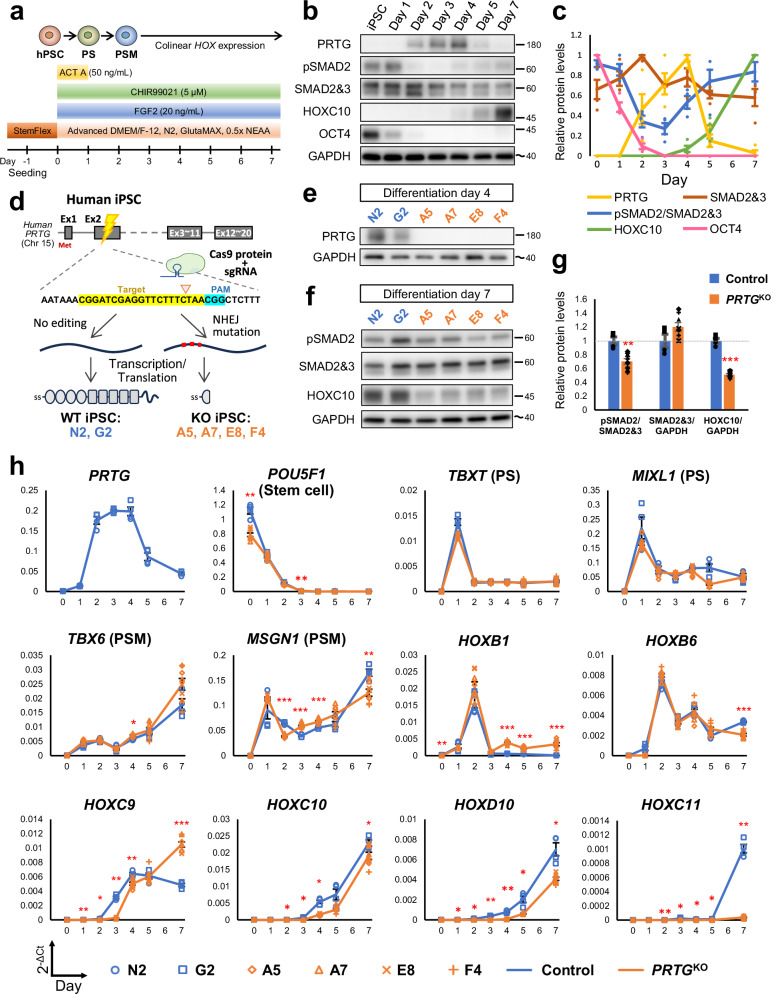
Fig. 6. Recapitulation of PRTG knockout (PRTGKO) phenotypes observed in embryos using an in vitro hiPSC-derived PSM model.
a Schematic illustration of the differentiation protocol for generating induced pluripotent stem cell-derived presomitic mesoderm-like (iPSC-PSM) cells. PS, primitive streak; PSM, presomitic mesoderm. b The protein levels of PRTG, pSMAD2, SMAD2/3, HOXC10, and OCT4 at different time points in differentiated iPSC-PSM cells from control clones were measured using a western blot. The molecular weight of nearby ladders is labeled. The estimated molecular weight size is labeled using a tilde. c Quantification results of Fig. 5b. Data are presented as the mean ± SEM (n = 4). d Schema illustrating the generation of PRTGKO (A5, A7, E8, and F4) and non-edited (G2 and N2) hiPSC clones via CRISPR/Cas9 gene editing. e PRTG expression in each hiPSC clone was validated using a western blot on day 4 of the iPSC-PSM model. f The protein levels of pSMAD2, SMAD2/3, and HOXC10 on day 7 of the hiPSC-PSM model were measured using a western blot. g Quantification results of Fig. 5f. Data are presented as the mean ± SEM (n = 4 for control group and n = 8 for PRTGKO group) (**p < 0.01; ***p < 0.001; by student’s t-test). h The expression levels of PRTG, stem cell marker (POU5F1, also known as OCT4), PS markers (TBXT and MIXL1), PSM markers (TBX6 and MSGN1), HOXB1, HOXB6, HOXC9, HOXD9, HOXC10, HOXD10, and HOXC11 from day 0 to day 7 of the differentiated hiPSC-PSM model were measured using RT-qPCR. RPL13A was used as the reference gene. Data are presented as the mean ± SEM (n = 4 for control group and n = 8 for the PRTGKO group) (*p < 0.05; **p < 0.01; ***p < 0.001; by two-way ANOVA).

