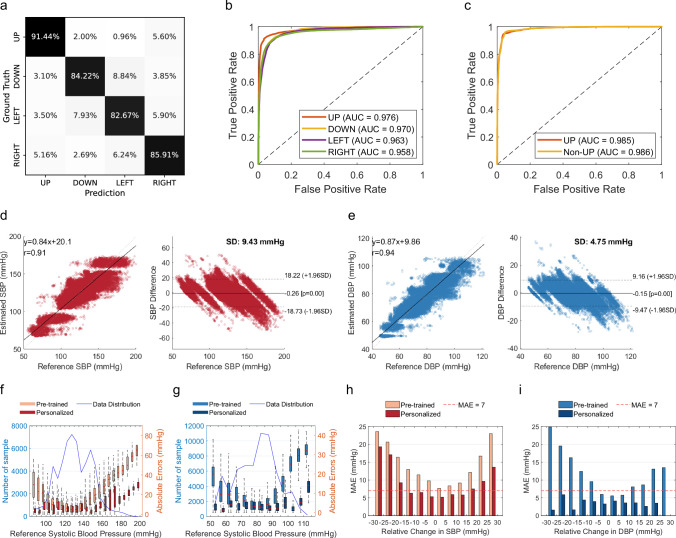
Fig. 4. Performance of the clinical study for continuous nocturnal blood pressure monitoring.
a Confusion matrix of sleep posture prediction during the day, grouped by four different sleep postures. b, c Receiver operating characteristic curves for four postures classification (b), and binary posture classification during the night (c). d, e The correlation and Bland–Altman plots for the self-collected nocturnal dataset, where d is for systolic blood pressure (SBP) results, and e is for diastolic blood pressure (DBP) results. f, g Mean absolute error (MAE) for different blood pressure levels before and after personalization, where f is for SBP results, and g is for DBP results. The blue line indicates the number of samples, while the box plots indicate absolute errors. Error bars represent the range of data within 1.5 times the interquartile range (IQR) from the first quartile (Q1) to the third quartile (Q3). h, i The distribution of MAE of all subjects at different BP change intervals, where h is for SBP results, and i is for DBP results. The red line indicates MAE = 7 mmHg. SD is the standard deviation of mean error.

