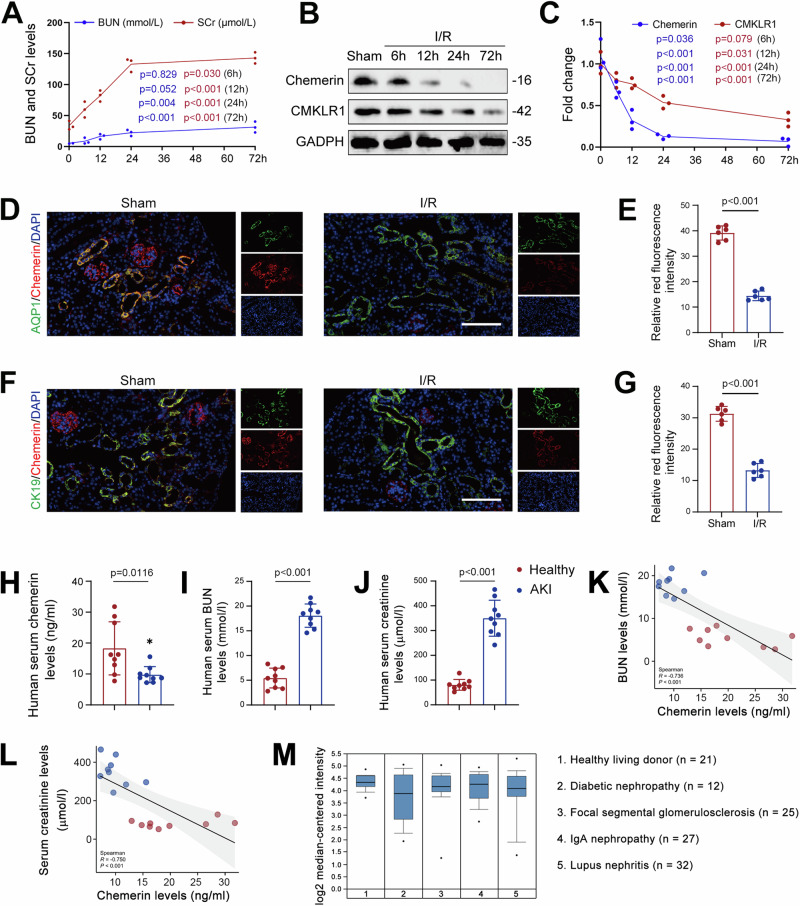
Fig. 1. Chemerin expression is reduced in AKI.
A Serum creatinine (SCr) and blood urea nitrogen (BUN) levels continuously increased in I/R model mice. n = 6 mice/group. B Temporal expression patterns of chemerin and CMKLR1 in the kidneys of I/R model mice. n = 3 (independent experiments). C Quantified data for chemerin and CMKLR1 from the western blots shown in (B). D–G Immunofluorescence analysis of chemerin (red; D, F) expression in the renal cortices. Relative immunofluorescence intensities for chemerin are presented in (E) and (G), respectively. AQP1 (green; D) and CK19 (green; F) were used as markers for renal tubular epithelial cells, and DAPI (blue) was used to stain the nuclei. Scale bar = 100 μm. n = 6 mice/group. Serum chemerin (H), blood urea nitrogen (BUN; I), and creatinine (J) levels in healthy individuals and AKI patients. n = 9 humans/group. Spearman correlation analysis between serum chemerin and BUN (K) or creatinine (L). n = 9 humans/group. M Chemerin expression decreased in nephropathy patients. Data analysis from Nephroseq database (https://www.nephroseq.org). Data are presented as the mean ± SD, *p < 0.05, **p < 0.01, ***p < 0.001. One-way ANOVA with Tukey’s multiple comparison test was used for (A) and (C), Student’s t test was used for (E), (G)–(J).

