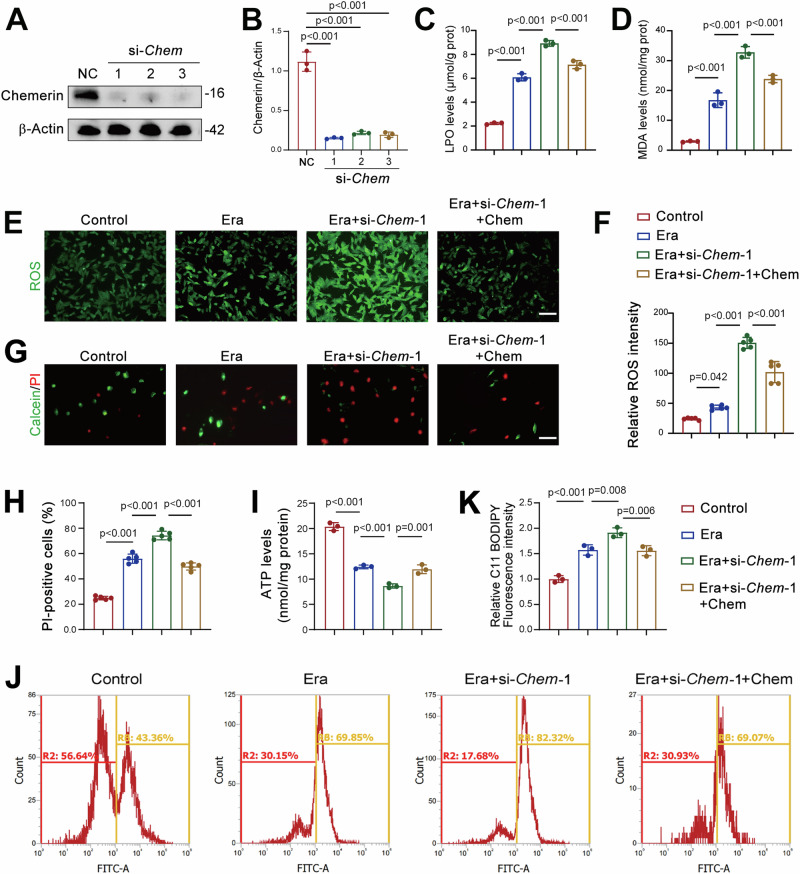
Fig. 4. Chemerin knockdown exacerbates ferroptosis in renal tubular cells.
A Western blot analysis showing the efficiency of chemerin knockdown. TCMK-1 cells were transfected with siRNA targets Chem (si-Chem). Seventy-two hours post-transfection, cells were harvested for western blot analysis. β-Actin was used as a loading control. n = 3 (independent experiments). B Quantified data from the western blots shown in (A). Recombinant chemerin counteracts the increases in lipid hydroperoxide (LPO; C) and malondialdehyde (MDA; D) levels induced by chemerin knockdown. TCMK-1 cells were transfected with si-Chem-1. Forty-eight hours post-transfection, cells were treated with recombinant chemerin (20 ng/ml) and erastin (Era, 5 μM) for additional 24 h. n = 3 (independent experiments). E Representative images showing reactive oxygen species (ROS). Cell treatments were described as in (C, D). n = 5 (independent experiments). Scale bar = 50 μm. F Quantified relative immunofluorescence intensity as shown in (E). G Calcein/PI staining showing live and dead cells. Cell treatments were described as in (C, D). n = 5 (independent experiments). Scale bar = 100 μm. H Quantified PI-positive cells from the calcein/PI staining in (G). I ATP levels. Cell treatments were described as in (C, D). n = 3 (independent experiments). J Lipid peroxidation. Oxidized lipids were captured by using C11 BODIPY and assayed by flow cytometry. Cell treatments were described as in (C, D). n = 3 (independent experiments). K Quantified lipid peroxidation from the flow cytometry in (J). Data are presented as the mean ± SD. **p < 0.01 and ***p < 0.001, by one-way ANOVA with Tukey’s multiple comparison test.

