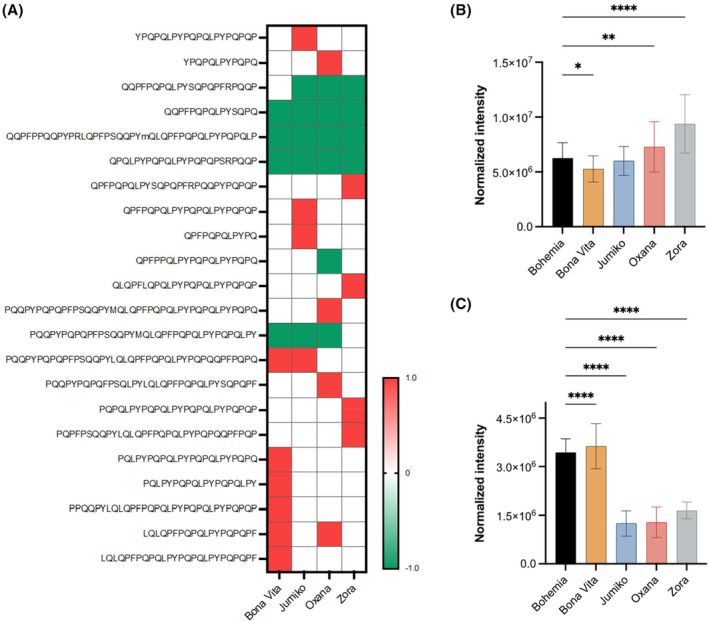
FIGURE 1.

Heatmap analysis (A) and normalised XIC intensities (B) of peptides containing at least one copy of PFPQPQLPY (DQ2.5‐glia‐α1a), PYPQPQLPY (DQ2.5‐glia‐α1b) or PQPQLPYPQ (DQ2.5‐glia‐α2) T‐cell epitopes in pigmented wheat grains. Only sequences showing statistically different changes to Bohemia are shown in (A) (p < 0.05). Red colour means ‘overproduction’ while green colour means ‘underproduction’ or absence. (C) Normalised XIC intensities of peptides containing at least one copy of DQ2.5‐glia‐𝛾1–5 T‐cell epitopes. Bars represent mean values ± standard deviation. *p < 0.05, **p < 0.01, ****p < 0.0001. Ion intensities have been normalised for the peptide load. From Dias et al. (2024).
