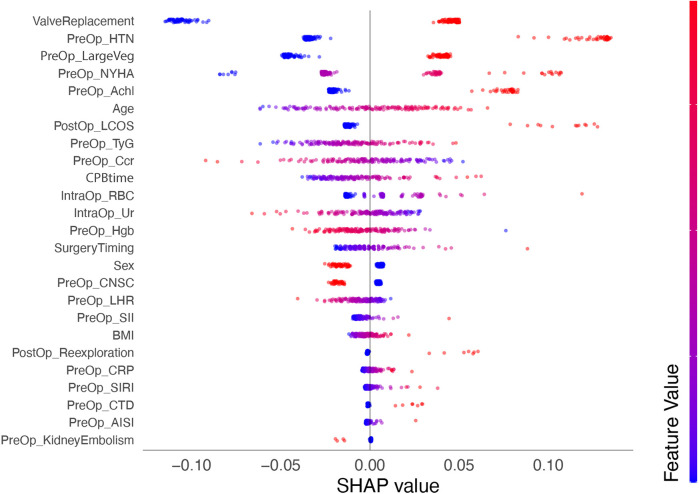
Figure 5.
SHAP summary plot depicting the influence of various features on the predicted outcome of AIE-CSA-AKI. Each point represents a SHAP value for a feature and a specific observation, showing the distribution of the impacts each feature has on the model output. The color intensity indicates the feature value (red-high, blue-low).

