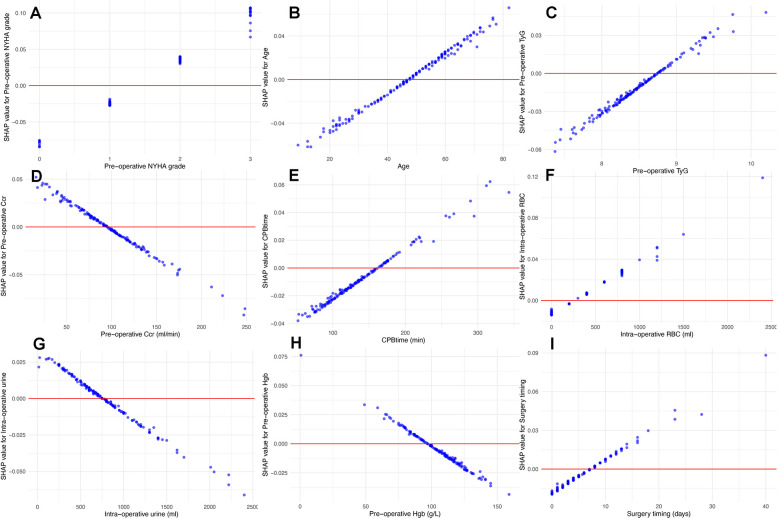
Figure 6.
Univariate SHAP dependence plots for numeric and ordinal categorical features. These plots illustrate the relationship between feature values and their SHAP values. These plots reveal how specific feature values influence the model's predictions, particularly identifying cut-off points where the impact of a feature shifts from “protective” to “risk”. According to the plots, NYHA class III or IV (A), age > 46 (B), TyG index > 8.75 (C), Ccr < 90 ml/min (D), CPB time > 160 min (E), intra-operative red blood cell transfusion > 300 ml (F), intra-operative urine output < 750 ml (G), pre-operative albumin < 97 g/L (H), and diagnosisto-surgery gap over 7 days (I) were associated with high AKI risk.

