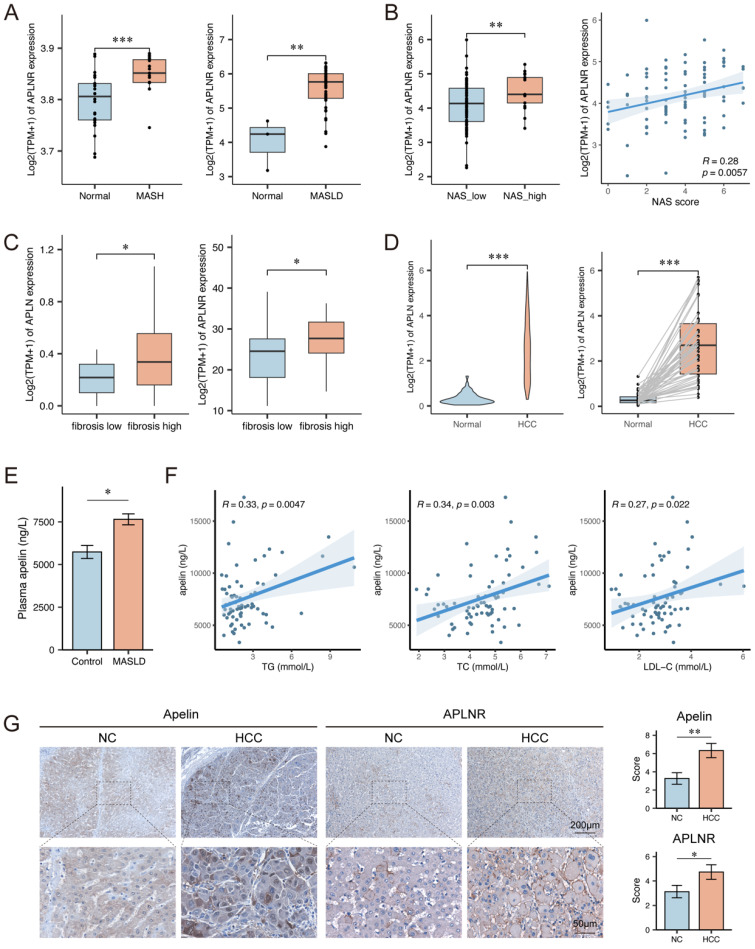
Figure 1.
Apelin and APLNR expression were up-regulated in livers of MASLD and HCC patients. (A) Box plots showing APLNR expression in the GSE89632 and GSE185051 datasets. (B) NAS score and expression of APLNR in GSE225740 dataset. (C) Expression of APLN and APLNR in the GSE240729 dataset among the low liver fibrosis (fibrosis score<2) and high liver fibrosis groups. (D) Unpaired and paired expression of APLN in the TCGA-LIHC dataset. (E) The concentration of apelin in the serum of MASLD patients (n=74) and healthy individuals (n=14) measured by ELISA. (F) Correlation analysis between serum apelin concentration and serum TG, TC, and LDL-C in MASLD patients (n=74). (G) Representative IHC staining results of apelin and APLNR in human HCC and peritumor tissues. The statistical analysis of the staining scores is shown on the right (n=30). The P values are calculated by two-tailed unpaired Welch's t-test (A-C, E), Mann-Whitney U test (D, G), two-tailed paired Student's t-test (D), or Spearman's correlation (B, F). *P < 0.05; **P < 0.01; ***P < 0.001

