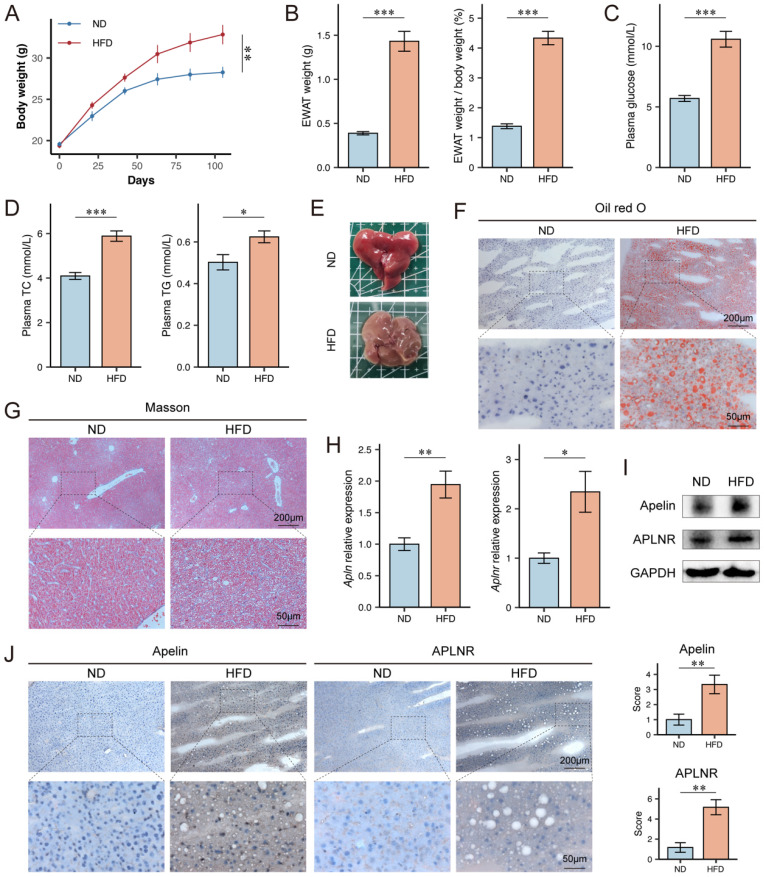
Figure 2.
Apelin and APLNR expression were up-regulated in livers of HFD mice. (A) Body weight of C57BL/6J mice on ND diet for 15 weeks and HFD diet for 15 weeks, recorded every 3 weeks (n=6). (B) After 15 weeks of feeding, the bilateral epididymal white adipose tissue (EWAT) of the mice was isolated and weighed (n=6). (C-D) Blood was collected from the mouse eye, and serum was separated for the measurement of glucose, TC, and TG using assay kits (n=6). (E) Mouse livers were isolated and photographed. (F) Liver tissues were cryosectioned and stained with an Oil Red O staining kit to visualize and image lipid content under a microscope. (G) Paraffin-embedded sections of the liver tissue were prepared and stained using a Masson's trichrome staining kit to assess the level of fibrosis. (H) RNA was extracted from mouse liver tissues using the Trizol method, and RT-PCR was conducted to determine mRNA levels of Apln and Aplnr (n=3). (I) Total protein was extracted from mouse liver tissues, and Western blot was used to determine the expression of apelin and APLNR (n=6). (J) Immunohistochemistry was performed on liver cryosections to detect apelin and APLNR. The statistical analysis of the staining scores is shown on the right (n=6). The P values are calculated by two-tailed unpaired Student's t-test (A, C, D), two-tailed unpaired Welch's t-test (B, H), Mann-Whitney U test (J). *P < 0.05; **P < 0.01; ***P < 0.001

