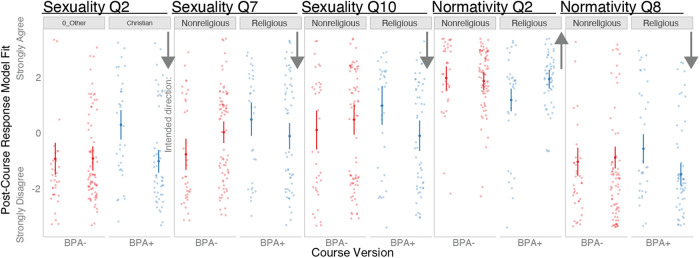
FIGURE 2.
Plots of significant interactions between course and identity variables. Plots depicting model fits for interactive effects of course and identities on postcourse survey responses. We show only the boxplots for terms where the interaction was significant. Blue indicates the identity of interest and red indicates the null identity. Solid dots indicate predicted means and the lines indicate 95% confidence intervals. Lighter dots indicate predicted data points based on the raw data. The leftmost plots depict interactions between course type and LGBTQ identity, and the rightmost plots depict interactions between course type and religious identity. All plots depict the values toward “Strongly Disagree” values as negative and the values toward “Strongly Agree” as positive. Faded points indicate individual survey responses from the raw data, after incorporating effects of other identities in the model.

