. 2024 Winter;23(4):ar54. doi: 10.1187/cbe.24-02-0047
© 2024 J. Srinivasan et al. CBE—Life Sciences Education © 2023 The American Society for Cell Biology. This article is distributed by The American Society for Cell Biology under license from the author(s). It is available to the public under an Attribution–Noncommercial–Share Alike 3.0 Unported Creative Commons License (http://creativecommons.org/licenses/by-nc-sa/3.0).
“ASCB®” and “The American Society for Cell Biology®” are registered trademarks of The American Society for Cell Biology.
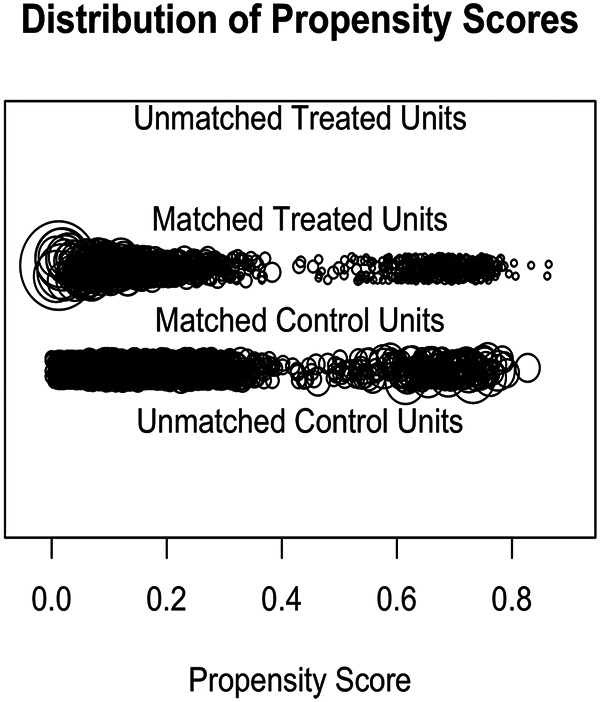
FIGURE 3.

Quality of matching depicted by the distribution of the propensity scores.
