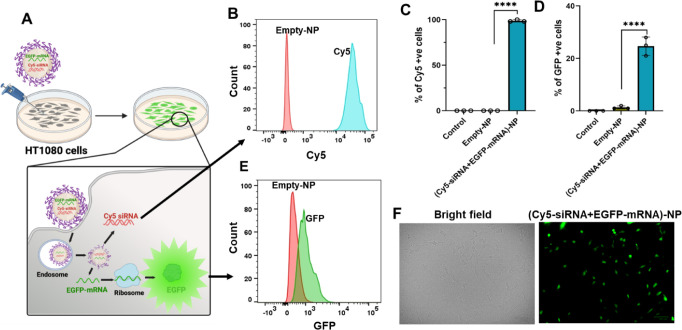
Figure 3.
Cellular interactions of codelivery NPs. (A) Model representation of NP treatment to HT1080 cells; Cy5 cellular entry and expression of EGFP. (B,E) Representative flow cytometry histogram showing Cy5 and GFP expression in HT1080 cells 48 h post-treatment with Cy5-siRNA+EGFP-mRNA-NPs (1 nmol + 0.016 nmol) or control-NPs. (C,D) Percentage of Cy5 and GFP in HT1080 cells (control: nontreated) quantified by flow cytometry 48 h post-treatment with Cy5-siRNA+EGFP-mRNA-NPs (1 nmol + 0.016 nmol) or control-NPs (10 μM); n = 3 (data represent means ± SD, ****p < 0.0001). (F) Fluorescence microscopy images of HT1080 cells after 48 h of treatment with dual-drug NPs or empty NPs (scale bar: 100 μm).

