. 2024 Dec 12. Online ahead of print. doi: 10.1039/d4sc06172a

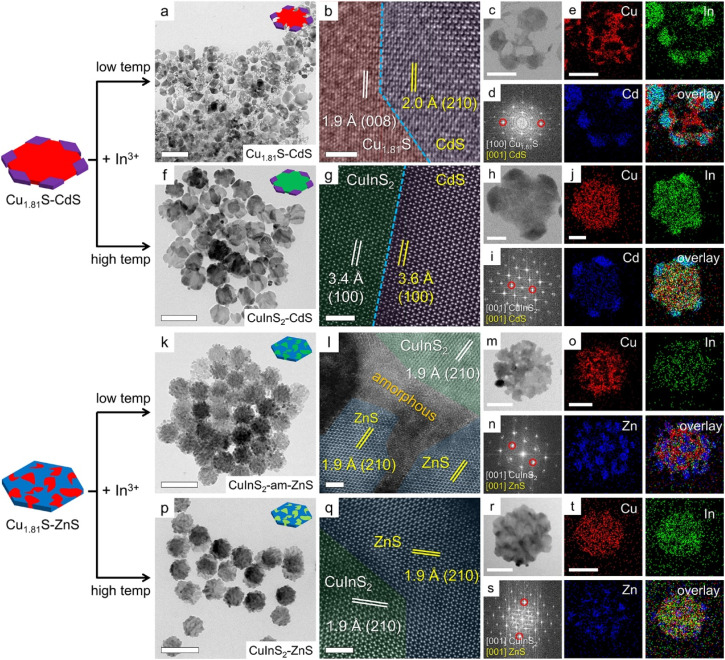
Fig. 4. CE reactions on Cu1.81S/CdS and Cu1.81S/ZnS heterostructures using In at low and high reaction temperatures. (a) TEM, (b) HRTEM, and (c) HAADF images, (d) FFT pattern, and (e) corresponding elemental maps of the CE reaction product obtained through In exchange on Cu1.81S/CdS at 55 °C. (f) TEM, (g) HRTEM, and (h) HAADF images, (i) FFT pattern, and (j) corresponding elemental maps of the CE reaction product obtained through In exchange on Cu1.81S/CdS at 155 °C. (k) TEM, (l) HRTEM, and (m) HAADF images, (n) FFT pattern, and (o) corresponding elemental maps of the CE reaction product obtained through In exchange on Cu1.81S/ZnS at 55 °C. (p) TEM, (q) HRTEM, and (r) HAADF images, (s) FFT pattern, and (t) corresponding elemental maps of the CE reaction product obtained through In exchange on Cu1.81S/ZnS at 155 °C. Scale bars: (a, f, k and p) 200 nm; (b, g, l and q) 2 nm; (c, h, m and r) 50 nm.

Fig. 4