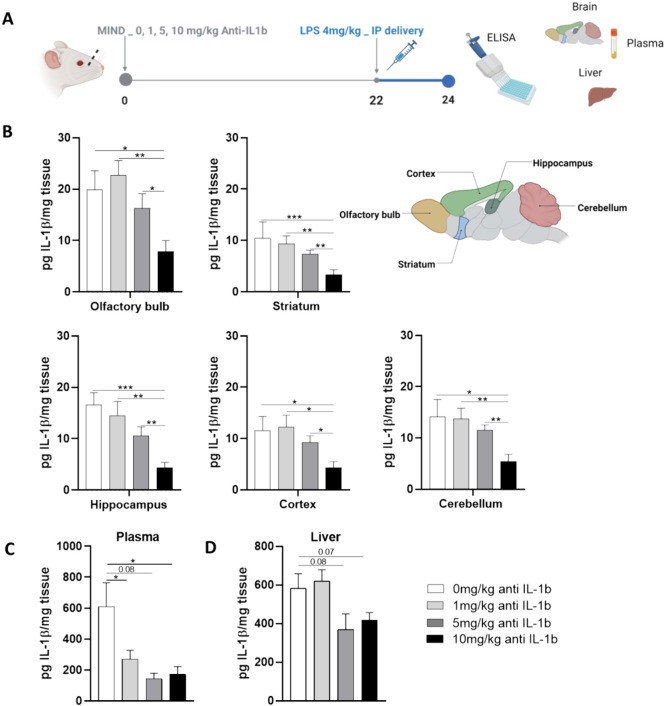
Figure 4.
Dose–response relationship. Reduction of IL-1β protein after antibody treatment. (A) Schematic of the experiment design. (B) IL-1β levels after the treatment with different doses of the antibody, e.g. 0 to 10 mg/kg, in the different subregions of the brain (C) IL-1β levels after the treatment with different doses of the antibody, e.g., 0 to 10 mg/kg, in plasma. (D) IL-1β levels after the treatment with different doses of the antibody, e.g., 0 to 10 mg/kg, in the liver. The data are described as the mean ± SEM (n = 6). *P < 0.05, **P < 0.01 ***P < 0.001.

