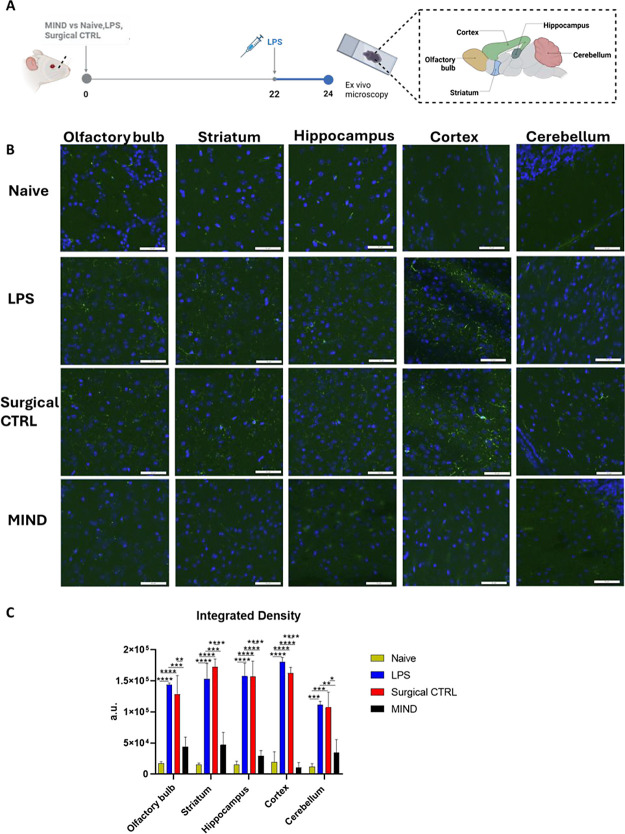
Figure 6.
Semiquantitative analysis of IBA-1 in the brain. (A) Timeline of the experiment; (B) representative pictures of the IBA-1 expression in the neuro-inflamed model mouse. Immunostaining of IBA-1 protein (depicted in green) conducted in various brain regions, olfactory bulb, hippocampus, striatum, cortex, and cerebellum, comparing the Naïve, LPS, Surgical CTRL group against the MIND group (scale bar 100 um): (C) Semiquantitative analysis of IBA-1 (n = 3).

