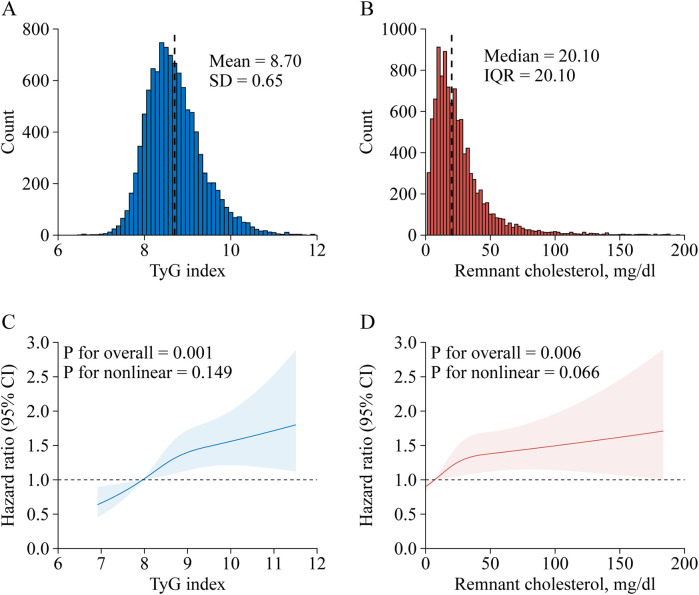
Figure 1.
Nonlinear associations of triglyceride-glucose index and remnant cholesterol with stroke risk. Distribution for TyG index (A) and remnant cholesterol (B); Graphs show HRs for stroke risk according to TyG index (C) and remnant cholesterol (D), all models were adjusted for age, gender, marital status, residence, education level, body mass index, smoking status, and drinking status, diabetes, hypertension, heart disease, dyslipidemia, kidney disease, history of medication use for diabetes, history of medication use for hypertension, history of medication use for dyslipidemia, systole blood pressure, diastolic blood pressure, HbA1c, hsCRP, and eGFR. Data were fitted by a restricted cubic spline Cox proportional hazards regression model. Solid lines indicate HRs, and shadow shapes indicate 95% CIs. CI, confidence interval; IQR, interquartile range; SD, standard deviation; TyG, triglyceride-glucose.

