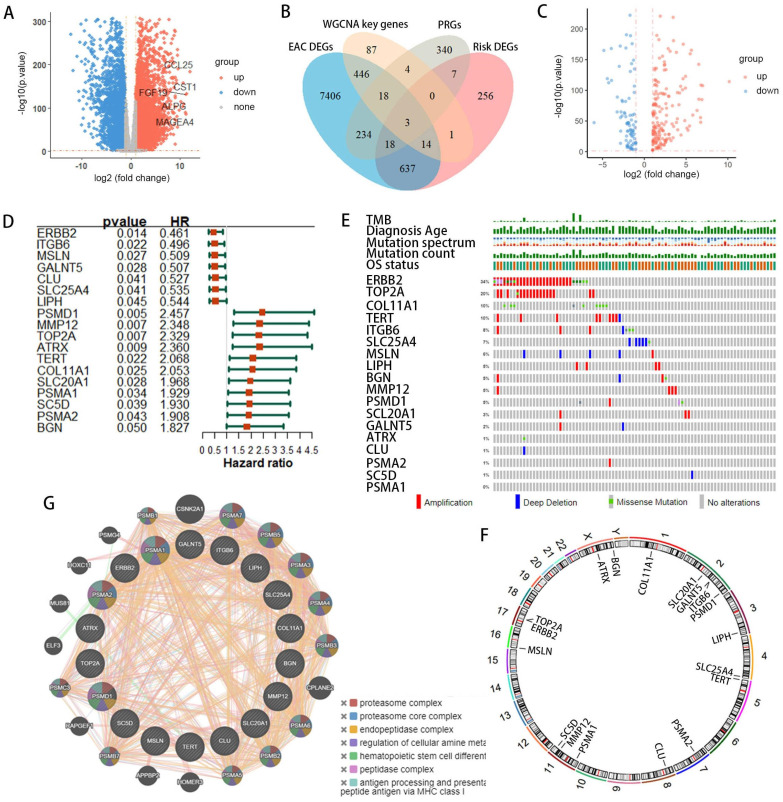
Figure 2.
Identification of prognostic-related DEPRGs in EAC patients using TCGA and GTEx databases. (A) Volcano plot illustrating DEGs between normal and tumor samples. (B) Venn diagram delineating the core prognostic-related DEPRGs among EAC-DEGs, PRGs, WGCNA key genes, and risk-related DEGs. (C)Volcano plot depicting DEPRGs. (D) Univariate Cox regression analysis forest plot correlating 18 prognostic-related DEPRGs with overall survival (OS). (E) Mutation frequencies of the 18 PRGs within the TCGA-EAC cohort. (F) Location of the18 prognostic-related DEPRGs on the chromosome. (G) Co-expression network of 18 prognostic-related DEPRGs was shown by GeneMANIA.

