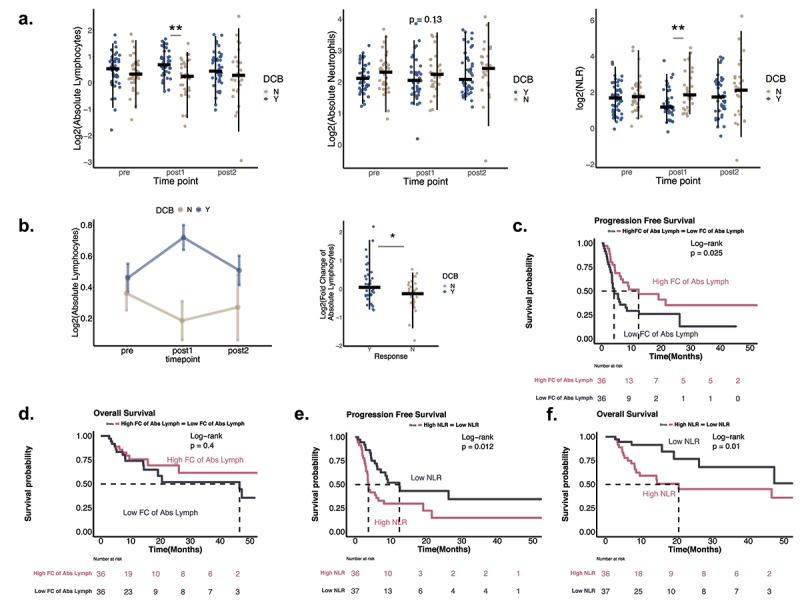
Figure 2.

Association of peripheral neutrophil and lymphocyte counts with response to therapy and survival. A. Association of peripheral neutrophil and lymphocyte counts at three time points with response to therapy. Wilcoxon rank-sum test was performed, with asterisks indicating significance level: p- value<=0.05*, p-value<=0.01**. Counts in DCB are shown in blue and in NCB in sand. NLR: Neutrophils to Lymphocytes ratio. (Pre: n = 85 samples, post1: n = 73 samples, post2: n = 73 samples) B. Change in peripheral lymphocyte counts by response to therapy. Left, change in mean lymphocyte count at three time points in DCB and NCB patients. Whiskers indicate mean standard error. Right, fold change of lymphocyte counts from pre to post1 between responders and non-responders (Wilcoxon rank-sum, p <0.05). (Pre: n = 85 samples, post1: n = 73 samples, post2: n = 73 samples; patients with matched pre and post1: n = 72 samples, DCB = 39, NCB = 33) C.D. Survival in patients stratified by fold changes of ALC from pre to post1 time point. PFS and OS stratified patients by the median of ALC. E.F. Survival in patients stratified by high and low NLR at the post1 time point. PFS and OS, stratifying by median level of NLR at post1 time point (2.67).
