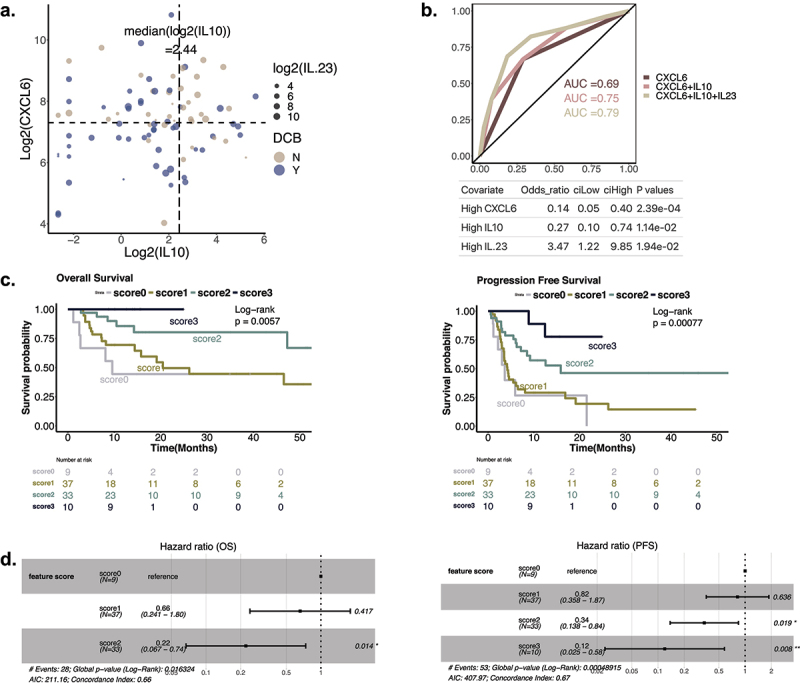
Figure 4.

Predicting response and survival with CXCL6, IL-10, andIL-23. A. Joint association of DCB with CXCL6, IL-10, and IL-23. x and y axes correspond with the levels of IL-10 and CXCL6, and the size of the dots represent the IL-23 level. Responders are colored with blue and non-responders with sand. The dotted lines represent the median value of CXCL6 and IL-10. B. ROC of the multivariate logistic regression models implemented with different features. Odds ratio of patients predicted to be DCB by the three-feature model = 8.97 (95% CI: 3.36-24.00, p = 0.0002827). C. Effect of feature scores on patients’ survival outcome. Patients were stratified into four groups using a feature score defined by the number of positive features (high IL23, low CXCL6, low IL10). D. Cox model on feature scores. (left) OS model showing hazard ratios of feature score 1 and 2, with 0 as reference. Feature score 3 was excluded from the model as the patient group with score 3 did not have any deaths. (right) PFS model showing hazard ratios of feature scores 1, 2, and 3, with 0 as reference.
