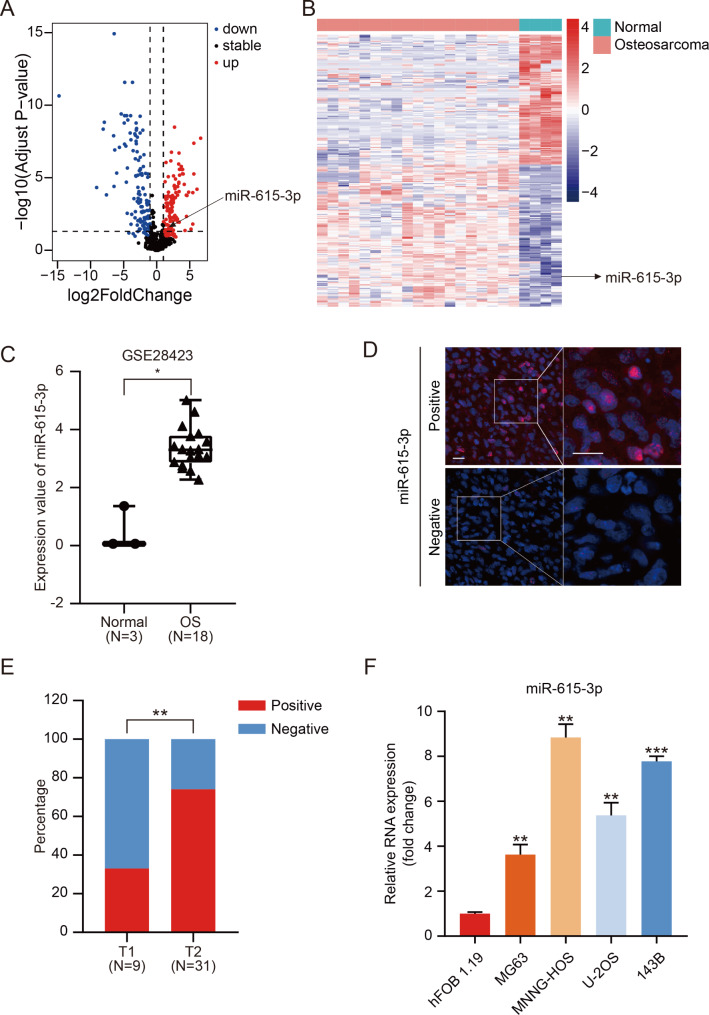
Fig. 1.
miR-615-3p was upregulated in OS cells and tissue. A. Volcano plot representing the differentially expressed genes in GEO datasets (GSE28423). B. Heatmap showed the differentially expressed genes in GSE28423 downloaded from the GEO database. C. The expression of miR-615-3p in normal and osteosarcoma samples of GSE28423 dataset. D. Representative FISH photographs of the expression patterns of miR-615-3p in human OS tissues. Scale bars = 20 μm. E. Statistical analysis of FISH results based on the expression level of miR-615-3p in T1 stage (n = 9) and T2 stage (n = 31) OS tissues. F. Relative miR-615-3p mRNA levels of MG63, MNNG-HOS, U-2OS and 143B relative to hFOB1.19 cells were determined using qRT-PCR. Results are displayed as mean ± SD, * indicates p < 0.05, ** indicates p < 0.01, *** indicates p < 0.001

