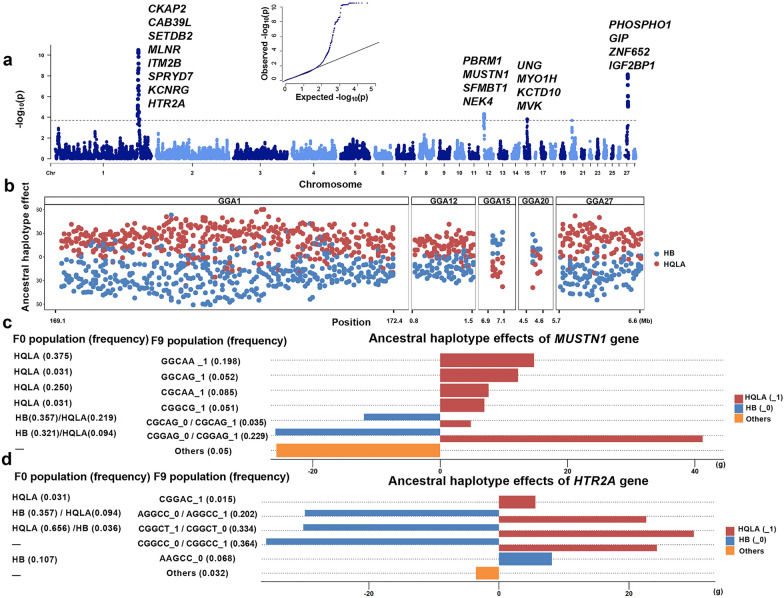
Fig. 3.
Results from the ancestral-haplotype-based GWAS and ancestral haplotype analysis. a Results from ancestral-haplotype-based GWAS, candidate genes overlapping with the peaks are presented (The dashed black horizontal line shows the FDR < 5% cutoff). b Estimates of effects of haplotypes of different ancestral origins in major QTLs. Red points indicate haplotypes from the HQLA population; blue points indicate haplotypes from the HB population. c Ancestral haplotype analysis for blocks that cover the MUSTN1 gene. Six haplotypes were retrieved from the HB population (nhap = 2) and the HQLA population (nhap = 6) with haplotype frequencies > 0.05. Red bars (_1) indicates haplotypes exclusive to the HQLA population, blue bars (_0) indicates haplotypes exclusive to the HB population, orange bars indicate haplotypes absent in both populations. d Ancestral haplotype analysis for blocks covering the HTR2A gene. Four haplotypes were retrieved from the HB population (nhap = 3) and the HQLA population (nhap = 2) with haplotype frequencies > 0.05

