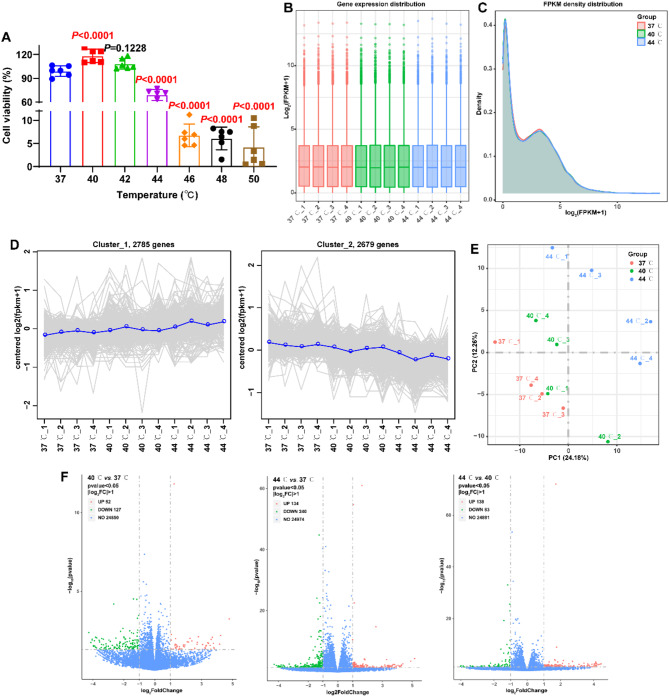
Fig. 1.
Effects of different temperatures on the viability of ATDC5 cells and differential expression analysis. A: After stimulation for 10 min at different temperatures (37 °C, 40 °C, 42 °C, 44 °C, 46 °C, 48 °C, and 50 °C), CCK-8 assay detected the viability of ATDC5 cells at 12 h (N = 6). Statistical analysis was completed using one-way ANOVA with Tukey’s multiple comparisons test, and P < 0.05 represents a significant difference. B: Box-whisker Plot visualized the distribution of gene with FPKM in the expression profiles of each sample. C: Density Plot characterized the density distribution of the gene with FPKM in the expression profiles of the 37 °C, 40 °C, and 44 °C groups. D: Cluster line plots identified the correlation between the expression patterns of different samples. E: Principal component analysis (PCA) characterized clustering and discretization of expression profiles for different samples. F: Volcano plots visualized the distribution of DEGs in 40 °C vs. 37 °C, 44 °C vs. 37 °C, and 44 °C vs. 40 °C

