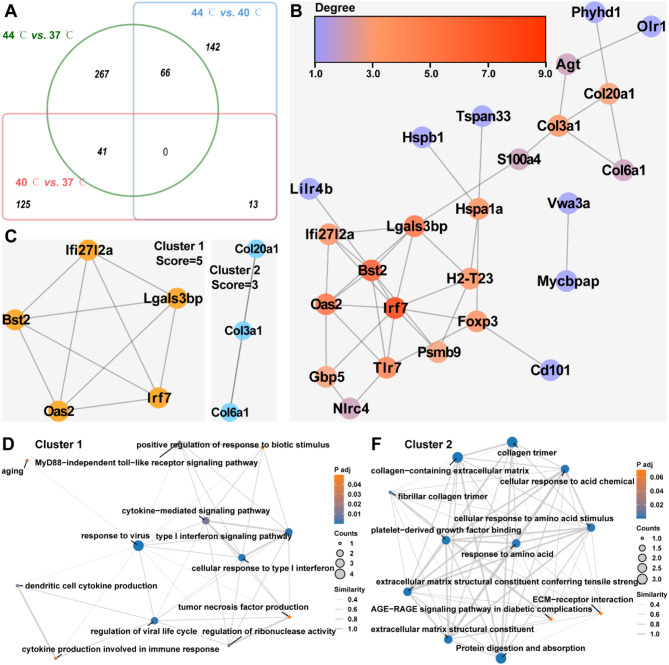
Fig. 6.
PPI Networks for Temperature treatment-associated DEGs. A: Venn diagrams showed intersecting and concatenated DEGs in 40 °C vs. 37 °C, 44 °C vs. 37 °C, and 44 °C vs. 40 °C. B: String database predicted interactions of intersecting DEGs and the visualization of PPI networks was conducted by Cytoscape software. The color of the node represents the size of the degree, and the redder the node, the larger the degree. C: Cluster analysis of PPI networks associated with intersecting DEGs was performed using the MCODE plug-in of Cytoscape software to identify sub-networks. D-F: EMAP plots exhibited the GO term and KEGG pathways associated with DEGs in cluster 1 (D) and cluster 2 (E), and the correlation between them

