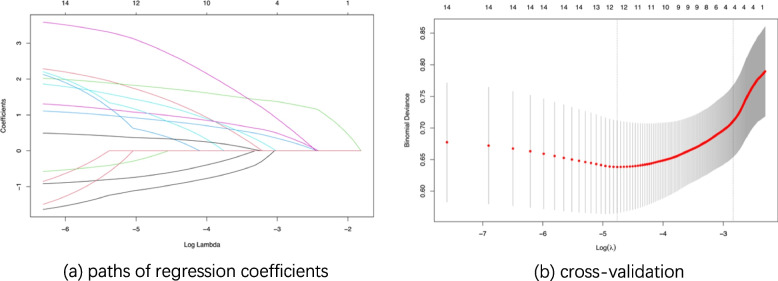
Fig. 2.
LASSO regression Note: (1) Fig. (3a) illustrates the change in variable coefficients as a function of λ values in LASSO regression. The horizontal axis represents the logarithmic values of λ, and the vertical axis represents the coefficient values. The top numbers indicate the number of variables with non-zero coefficients. (2) Fig. (3b) presents the results of cross-validation in LASSO regression. The vertical axis represents the mean squared error values, and the horizontal axis represents the logarithmic values of λ. The dashed lines on the left side represent the minimum mean squared error value, and the dashed lines on the right side represent the optimal λ value

