
FIGURE 2.
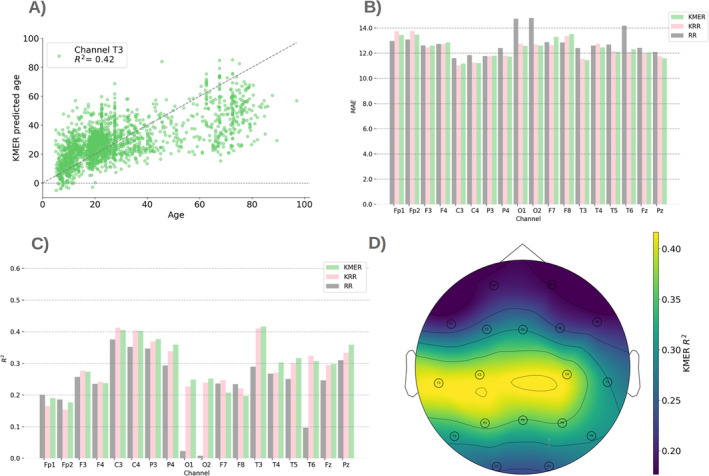
Comparison between the methods. (A) Illustration of predicted versus real age for example channel T3 for KMER. (B) Mean absolute error (MAE) per channel for KMER, RR, and KRR. (C) Explained variance R 2. (D) R 2 projected on the sensor space for KMER.