
FIGURE 3.
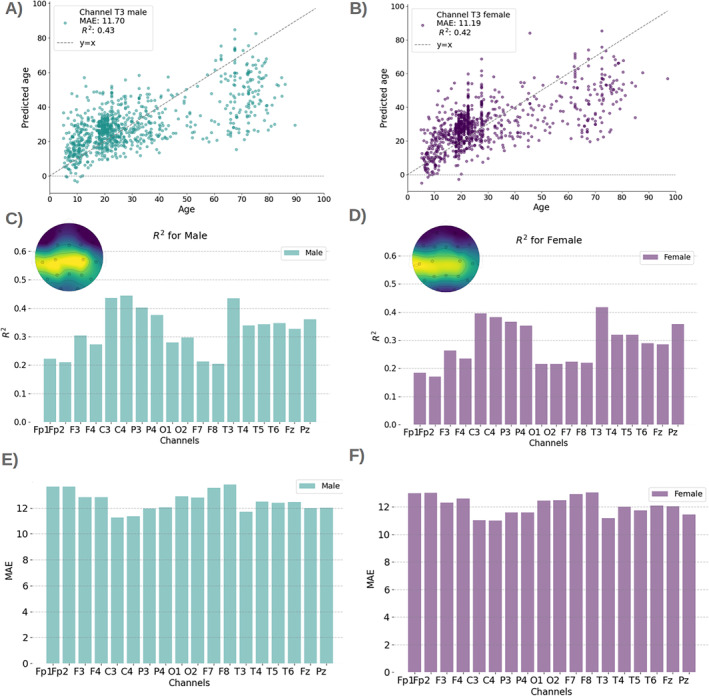
Sex differences (left panels, male; right panels, female). (A, B) Predicted versus real age per sex for example channel T3; results are consistent for all channels (not shown). (C, D) Explained variance R 2 per sex and channel, in bar plot format and a topographic map. (E, F) MAE per sex and channel.