
FIGURE 4.
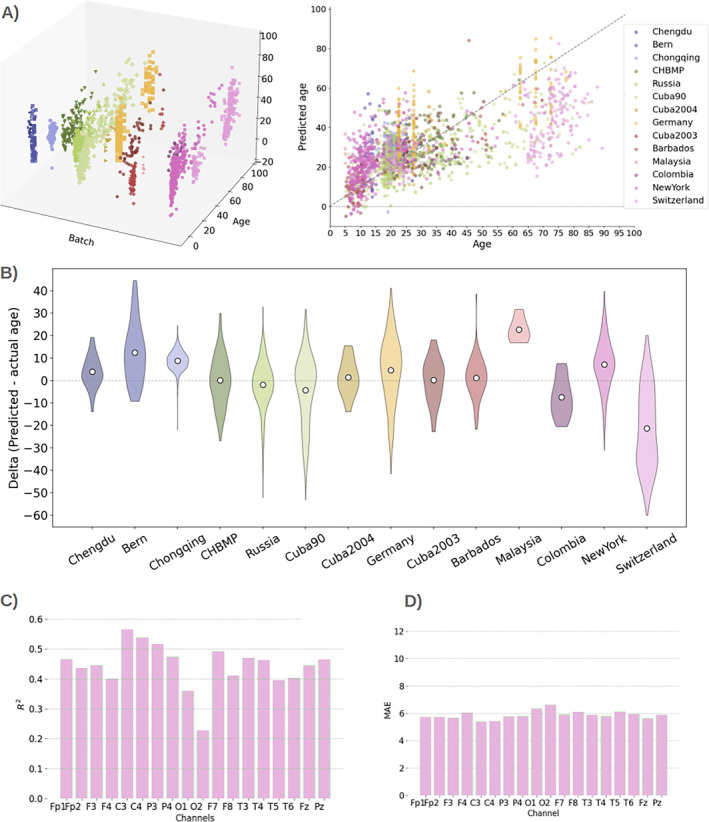
Differences between sites and their effect on the prediction. (A) Predicted versus real age in 3D (left) and 2D (right), separated by site (batch). (B) Distribution of delta (defined as predicted minus real age) per site. (C, D) R 2 and MAE where training and testing come from a single site (New York).