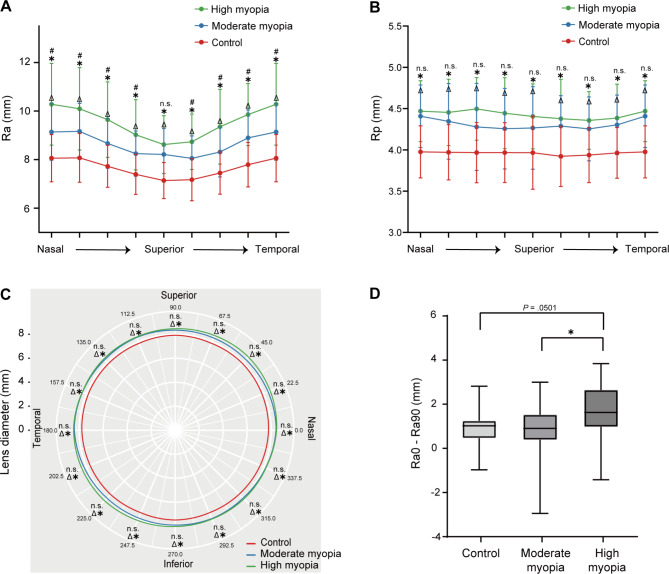
Fig. 4.
Morphologic features of lenses in eight directions. (A) radii of curvature of anterior surface (Ra) and (B) posterior surface (Rp) in eight directions among three axial length (AL) groups. (C) Circular plot of lens diameter presenting the real data collected from eight directions with data points smoothly connected by curves using the R “ggplot2” package. For (A), (B) and (C): *comparisons between high myopia and control groups, P < .05; Δcomparisons between moderate myopia and control groups; n.s., not significant. (D) Difference values of Ra in horizontal axis (Ra0) minus Ra in vertical axis (Ra90) in three different AL groups. *P < .05. All data in this figure were analyzed using analysis of covariance with Bonferroni post hoc test

