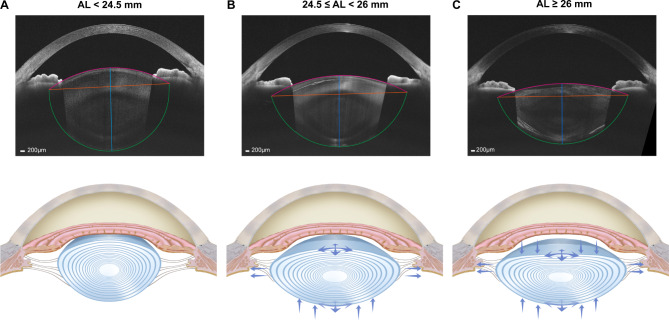
Fig. 5.
Schematic diagram of lens changes as the axial length (AL) elongated. (A) A lens with a normal AL was shown (AL < 24.5 mm). (B) Moderate elongation of AL made the lens diameter (LD) get larger and posterior lens thickness (LT) get thinner, resulting in radii of curvature of anterior surface (Ra) and posterior surface (Rp) greater (24.5 ≤ AL < 26 mm). (C) As AL further elongated, anterior LT got thinner, while the LD and posterior LT changed less, which made Ra get even greater while Rp show less change (AL ≥ 26 mm)

