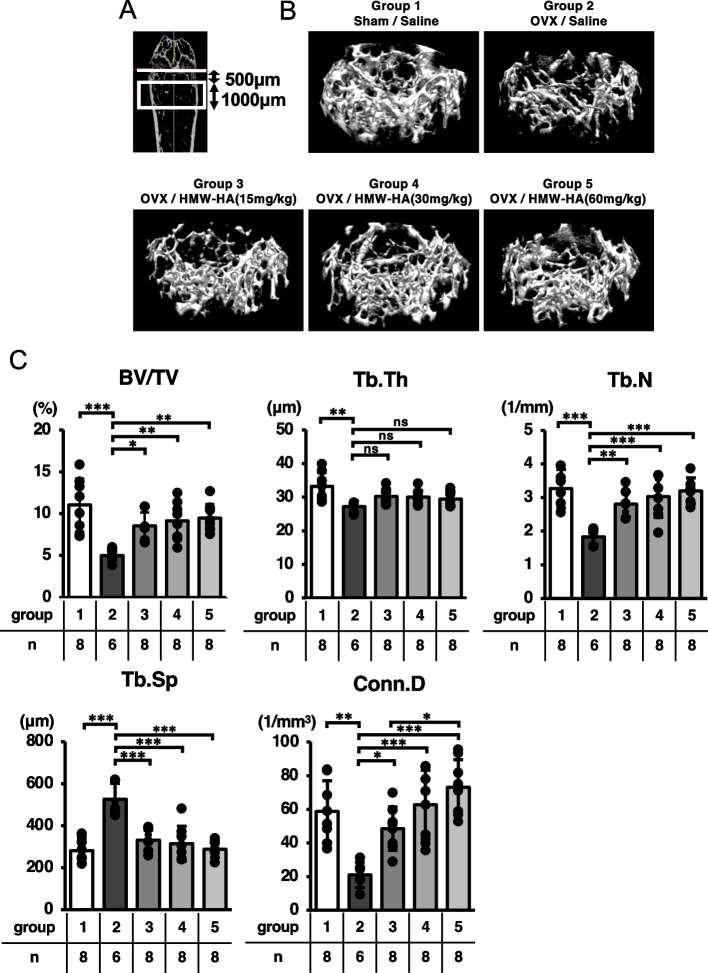
Fig. 2.
HMW-HA reversed OVX-mediated bone loss. A The area computed by 3D-μCT analysis is indicated in the box in white. B Representative 3D μCT images of trabecular bone microarchitecture in the distal femurs of each group are indicated. C Bone volume (BV/TV), trabecular thickness (Tb. Th), number (Tb. N), separation (Tb. Sp) and connectivity density (Conn. D). Data are expressed as mean ± SD, analyzed by ANOVA followed by Tukey’s post hoc test, showing all data points. *p < 0.05, ** p < 0.01, *** p < 0.001. ns, not significant. The number of samples are indicated at the bottom of each figure and in Supplementary Table 2

