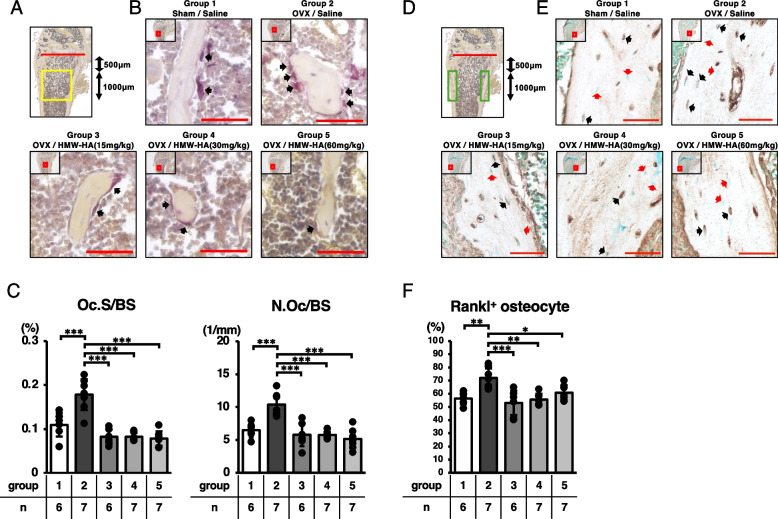
Fig. 3.
HMW-HA downregulated osteoclastic bone resorption in ovariectomized mice through the downregulation of RANKL-expressing osteocytes. A The area analyzed for osteoclast parameters is indicated in the box in yellow. B Representative images of TRAP staining. Low-power images boxed in red are enlarged and presented in each panel. Black arrows indicate osteoclasts. Red bars in high-power images indicate scale bars (50 μm). C Bone resorption parameters including osteoclast surface per bone surface (Oc.S/BS) and osteoclast number per bone surface (N.Oc/BS) of each sagittal section. D The area analyzed for Rankl+ osteocyte percentage is indicated in the box in green. E Representative images of RANKL-positive osteocyte lacunes. Low-power images boxed in red are enlarged and presented in each panel. Black arrows indicate RANKL-positive osteocyte lacunes. Red arrows indicate osteocytes with no RANKL expression. Red bars in high-power images indicate scale bars (50 μm). F The Rankl.+ osteocyte percentage was qualitatively assessed in each group. Data are expressed as mean ± SD, analyzed by ANOVA followed by Tukey’s post hoc test, showing all data points. *p < 0.05, ** p < 0.01, *** p < 0.001. The number of samples are indicated at the bottom of each figure and in Supplementary Tables 3 and 4

