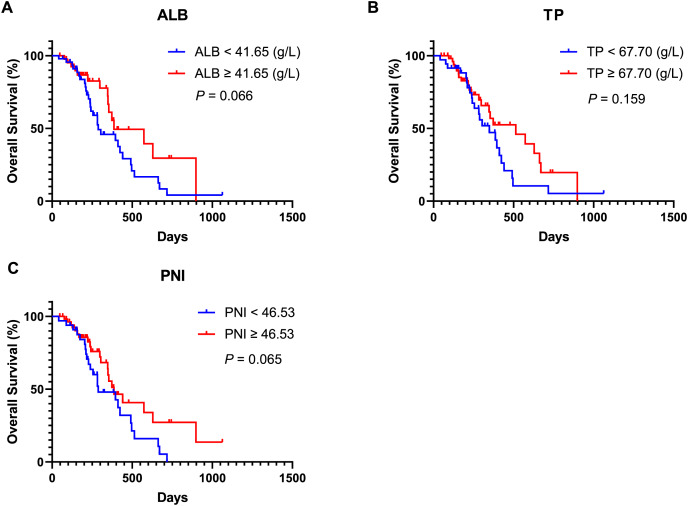
Figure 4. Kaplan-Meier curve for OS in AGC patients receiving immune checkpoint inhibitors combined with chemotherapy stratified based on baseline nutritional indicators.
(A) Kaplan-Meier curve for OS in patients stratified based on baseline ALB. (B) Kaplan-Meier curve for OS in patients stratified based on baseline TP. (C) Kaplan-Meier curve for OS in patients stratified based on baseline PNI. P < 0.05 is considered statistically significant. Abbreviation used: AGC, advanced gastric cancer; OS, overall survival; PD-1, Programmed Cell Death Protein-1; ALB, Albumin; TP, Total protein; PNI, prognostic nutritional index.

