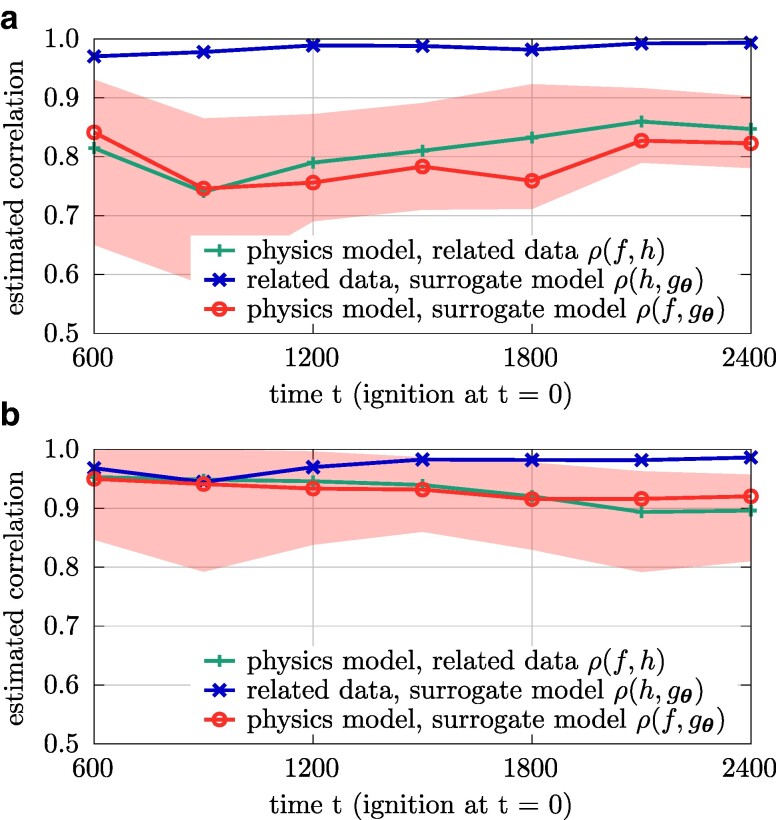
Fig. 4.
The estimated correlation coefficients show that the physics model is well correlated to the surrogate models trained on the related training data. The shaded area corresponds to the upper and lower bound of the correlation coefficient , see Proposition 1. a) Input distribution given in Eq. (7). b) Input distribution given in Eq. (8).

