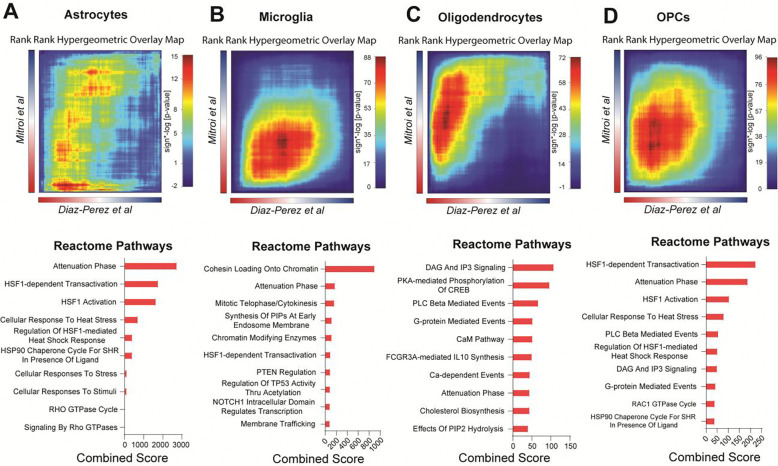
Figure 6. Rank-Rank Hypergeometric analysis reveals increased heat shock protein responses as a conserved feature across two independent datasets.
RRHO heatmaps showing overlap of pre-ranked gene lists (VaD vs Control) from (A) astrocytes, (B) microglia, (C) oligodendrocytes and (D) OPCs from out dataset (DiazPerez et al) and the Mitroi et al dataset. Overlap on the top right corner of the heatmap is indicative of common downregulated genes while overlap on the bottom left is indicative of common upregulated genes. Heatmap is colored by signed −log(p-value). Top 10 Reactome gene sets from overlapping genes are shown below the respective heatmap as barplots ranked by combined score.

