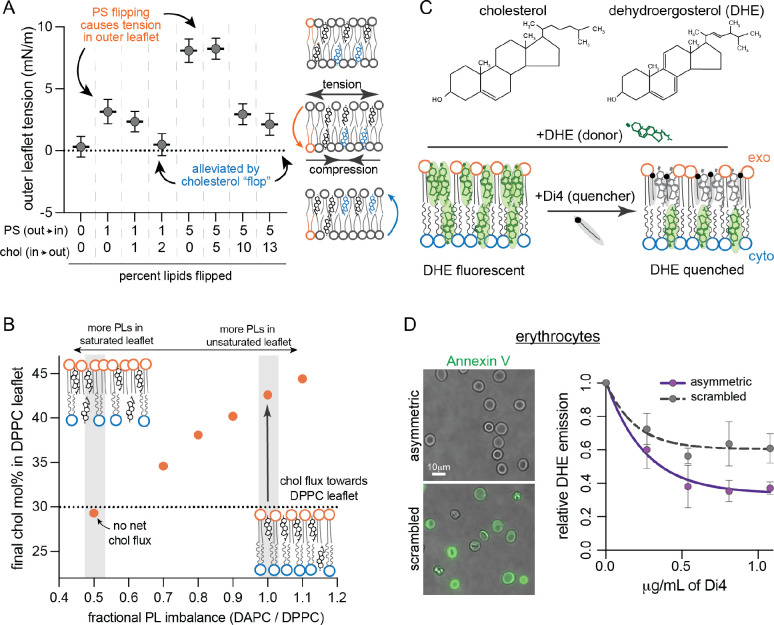
Fig. 3. Cholesterol interleaflet distribution in model and cell membranes.
(A) Leaflet tension (differential stress) in the outer leaflet of simulated bilayers composed of POPS (PS), POPC and cholesterol (Chol) modeling various extents of PS and Chol flipping. Atomistic bilayers were constructed with the indicated percentage of PS lipids effectively flipped from the outer leaflet to the inner leaflet, and Chol molecules flopped from the inner to the outer leaflet (Table S3). Outer leaflet tension calculated from equilibrated lateral pressure distributions; inner leaflet is under an equal magnitude compression. (B) Cholesterol distribution in coarse-grained asymmetric bilayers composed of a fully saturated outer leaflet (DPPC) with fixed number of PLs opposing a highly unsaturated inner leaflet (DAPC) with varying PL abundance (Table S4). The fractional imbalance of DAPC-to-DPPC lipids goes from underpopulated DAPC leaflet (left) to underpopulated DPPC leaflet (right). Chol was initiated at 30 mol% in each leaflet. Simulations were run for 10 μs allowing Chol to equilibrate between the two leaflets; the equilibrated cholesterol concentrations in the outer leaflet are shown. Schematics of the equilibrated relative lipid distributions are shown for comparison. (C) Schematic illustration of experimental approach for measuring Chol interleaflet distribution in erythrocytes. Minor fraction (<10%) of cholesterol in the erythrocyte PM is exchanged with DHE. A quencher, Di4, is added externally leading to its insertion into the outer leaflet. The fraction of DHE fluorescence quenched by Di4 provides a readout of relative DHE residence in the exoplasmic leaflet. (D) DHE fluorescence in erythrocyte membranes as a function of Di4 concentration. Data shown for untreated cells and cells whose PM lipids were scrambled with 100 μM PMA. Representative images show binding of PS-marker Annexin V before (top) and after (bottom) PMA treatment. Average ± SD for 3 independent experiments.

